Biomedical Engineering Reference
In-Depth Information
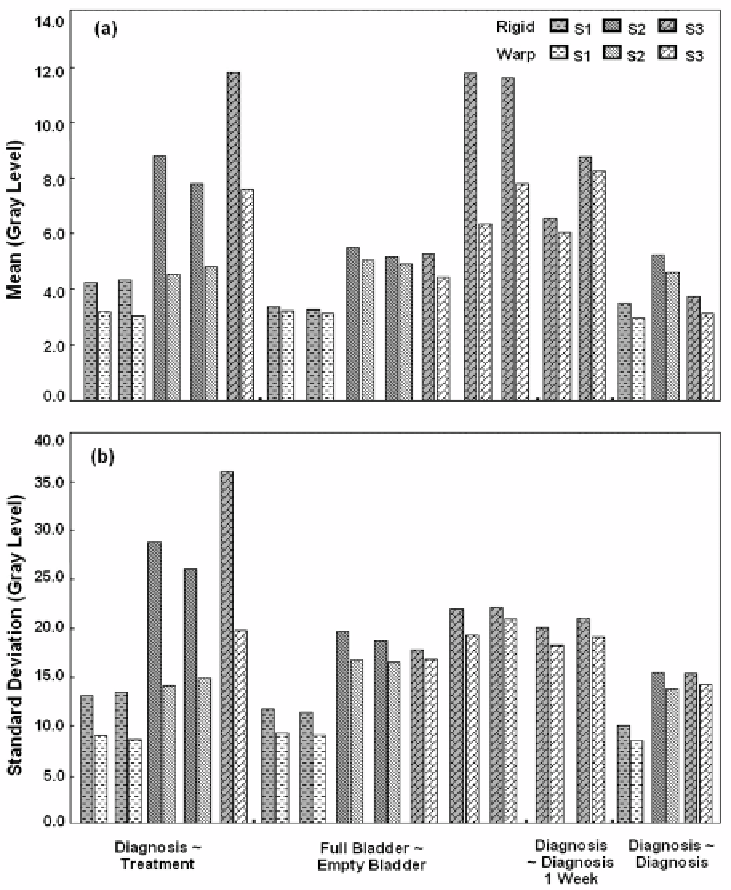
Figure 3.15: Image statistics of absolute intensity difference images for rigid
body and warping registration. The mean (a) and standard deviation (b) are
plotted. See the legend of Fig. 3.14 for other details. Warping decreased the
mean and standard deviation in each case, but the most significant decreases
occurred in the case of the treatment-diagnosis volume pairs. After warping, the
intensity averaged over all data is 4.2
±
1.9 gray levels, a value corresponding to
only
≈
4
.
7% of the mean image value of
≈
90 gray levels.