Biomedical Engineering Reference
In-Depth Information
−
−− − −
−
−− −
−−−−
−−−−
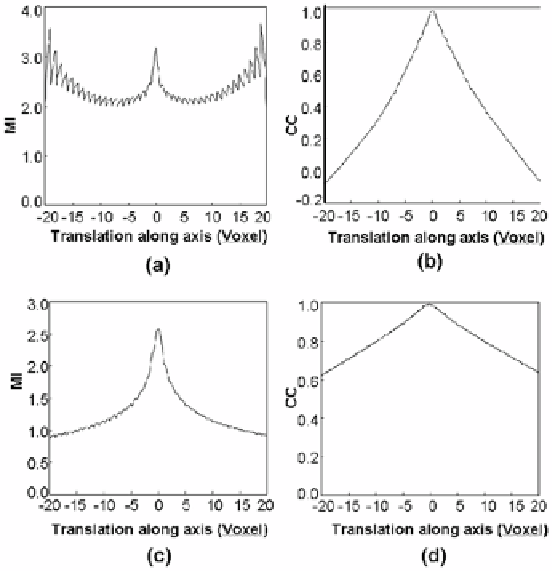
Figure 3.1: MI and CC similarity functions are plotted to show their relative
advantages for registration at different resolutions. Two high-resolution MRI
volumes were registered to obtain the optimal parameters. We then computed
similarity values as a function of translation along the transverse axis. MI is
plotted in (a) and (c); CC is plotted in (b) and (d). Graphs on the top, (a) and
(b), are at a resolution of 1/4 voxels along a linear dimension, giving a distance
between voxel centers of
≈
5.5 mm. MI gives a noisy plot having many local
maximums, and a false global maximum occurs at 18 voxels. Graphs on the
bottom are obtained at full resolution. MI has a much sharper peak than CC,
which is relatively flat. The voxel size is 1.4 mm. Images are from volunteer V2
in the diagnostic and reference conditions.
to the optimum value. As described in Section 3.2.2, our registration algorithm
makes use of these features.
3.2.2
Registration Algorithm with Special Features
The algorithm shown in Fig. 3.2 include special features to improve robustness
for registration of MR prostate images. We use a multiresolution approach and