Biomedical Engineering Reference
In-Depth Information
Figure 2.6 were used for segmentation of the ultrasound data after denoising
with a spatio-temporal brushlet expansion [106]. The model was initialized with
a cone in which dimensions were defined manually on slices at the base and
apex. Manual tracing on ultrasound data was performed by an expert clinician.
MRI data were also acquired on the patients and manually traced by a second
expert. Absolute errors of measures were computed for RV and LV ejection-
fraction. Mean-error values and standard deviation over the 10 cases for the two
ventricles were equal to [Mean Std Max Min]: [8.6% 5.7% 17.8% 0.3%] for manual
tracing on ultrasound vs. MRI, [4.9% 4.1% 12.21% 0.2%] for 2D parametric de-
formable model vs. MRI, [4.6% 4.2% 13.9% 0.8%] for 3D level set deformable
model vs. MRI. Improvement of correlation measurements with deformable
models (with good statistical significance) was reported when compared to
MRI as well as better accuracy with a Bland-Altman analysis. The study con-
cluded that errors of EF measurements using deformable models were within
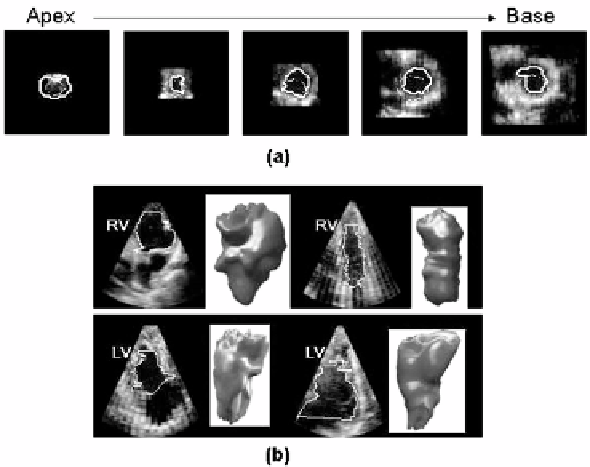
Figure 2.6: Segmentation of right and left ventricular volumes with a 3D implicit
deformable model on RT3D ultrasound data. (a) Initialization of the segmenta-
tion with a cone shape surface (dashed line) and final position of the contour
(continuous line) on the endocardial surface. (b) Illustration of diversity of right
and left ventricular shapes and sizes extracted for the clinical study reported in
[43].