Biology Reference
In-Depth Information
Ca
2+
i
pERK1/2
B
1.0
-1.0
0.8
-0.8
0.6
-0.6
-0.4
0.4
0.2
-0.2
cAMP
cAMP
-1.0
-0.8
-0.6
-0.4
-0.2
0
0.2
0.4
0.6
0.8
1.0
-0.2
0.2
-0.4
0.4
-0.6
0.6
-0.8
0.8
-1.0
1.0
Ca
2+
i
pERK1/2
PTH (1-34)
PTH (1-31)
E
max
−
B
EC
50
−
A
(Trp
1
)-PTHrp (1-36)
RA
i
=
PTH (3-34)
PTH (7-34)
(D-Trp
12
,Tyr
34
)-PTH (7-34)
E
max
−
A
EC
50
−
B
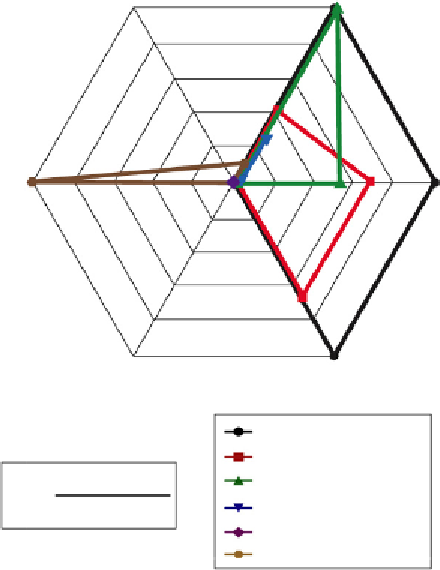
Figure 18.1
cont'd (B) Multiaxial representation of PTH
1
R ligand activity in three dif-
ferent assays of receptor activation: cAMP production, intracellular calcium influx, and
ERK1/2 phosphorylation. Estimated RA
i
values for each ligand are plotted on each axis to
represent the magnitude and direction of effects in each signaling response. Ligands
with
—
31) show effects of similar
amplitude and direction on all three axes, while those demonstrating
“
balanced
”
efficacy such as hPTH1
-
34 and hPTH(1
-
show dis-
proportionate activity in one or more pathways or reversal of efficacy. Reproduced from
Ref.
20
.
“
bias
”
co-evolved with the receptor to elicit the most physiologically adaptive set
of downstream signals. Like a full agonist, a conventional partial agonist (B)
does not discriminate between “active” states, but because it possesses a
lower intrinsic efficacy, only a fraction of the receptor population will be
in an active state at full receptor occupancy. In contrast, a “biased” agonist
(C) exhibits selective binding to a subset of the “active” receptor conforma-
tions, such that at full receptor occupancy, some active states are favored

Search WWH ::

Custom Search