Biology Reference
In-Depth Information
B
A
Vehicle
PTH
PTH-
β
arr
†††
0.300
**
0.275
0.250
0.225
**
10 mm
10 mm
10 mm
0.200
0.175
0.150
0.125
Veh
PTH
(1-34)
PTH-
β
Veh
PTH
(1-34)
PTH-
β
arr
arr
10 mm
10 mm
10 mm
-Arrestin 2
−
/
−
WT
β
C
Vehicle
PTH
PTH-
β
arr
D
**
1.0
**
†††
0.8
0.6
100
μ
m
100
μ
m
100
μ
m
0.4
0.2
0.0
Veh
PTH
(1-34)
PTH-
β
Veh
PTH
(1-34)
PTH-
β
arr
arr
β
-Arrestin 2
−
/
−
WT
100
μ
m
100
μ
m
100
μ
m
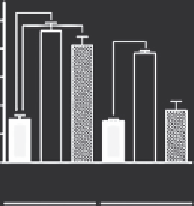
Figure 13.1 Arrestin pathway-selective biased agonism at the PTH
1
R promotes bone
formation independent of G protein activation. (A) Representative quantitative micro
CT (qCT) of proximal tibia from male wild-type (WT) and
-arrestin 2
/
mice treated
b
34) or
D
-Trp
12
,
for 8 weeks with daily injections of vehicle, or (40
g/kg/day) of PTH(1
m
-
Tyr
34
-bPTH(7
1.0 mm. (B) qCT of proximal tibia was used
to determine the effects of intermittent PTH(1
34) [PTH-
arr]. Scale bar
¼
-
b
34) or bPTH(7
34) on trabecular bone
-
-
(Tb) volume fraction (BV/TV). Data represent the mean
SEM of measurements taken
from at least seven male mice. (C) Representative calcein double-labeled, non-
decalcified, 10-
m
m sections of lumbar vertebrae from male WT and
b
-arrestin 2 null
mice were treated for 8 weeks with either vehicle, PTH(1
-
34) or bPTH(7
-
34). Scale
bar¼100
m
m. Bone formation rates are determined by calcein-double labeling
(arrows). (D) Quantitation of bone formation rates from calcein-labeled trabecular
bone. Data represent the meanSEM of measurements from four mice. *P
<
0.05,
**P
<
0.01, ***P
<
0.001 compared with vehicle-treated mice.
†
P
<
0.05,
††
P
<
0.01,
†††
P
<
0.001 compared with vehicle-treated
b
-arrestin 2 null mice. Significance deter-
mined by one-way ANOVA with Bonferroni correction. Adapted from data originally
published in Ref.
15
.


Search WWH ::

Custom Search