Geology Reference
In-Depth Information
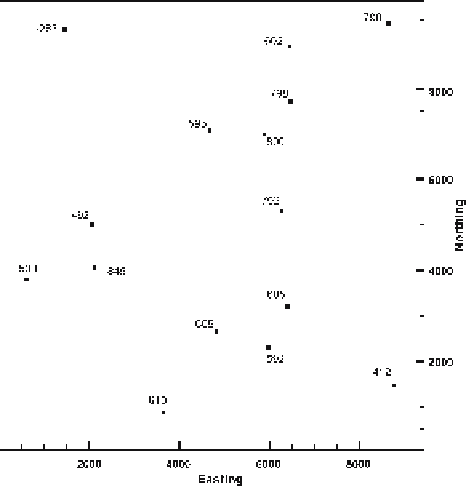
Fig. 3.5.
Elevations of the top of a
marker unit that will be con-
toured using different tech-
niques in Figs. 3.6-3.13
3.4.1
Choosing the Neighboring Points: TIN or Grid?
Drawing a contour between control points requires first deciding which control points
from the complete data set are to be used. This decision is not trivial or simple. The
choice of neighboring points between which the contours are to be drawn has a major
impact on the shape of the final surface. Two procedures are in wide use, triangula-
tion and gridding. Triangulation involves finding the TIN network of nearest neigh-
bors in which the data points form the nodes of the network (Fig. 3.6a). Gridding
involves superimposing a grid on the data (Fig. 3.6b) and interpolating to find the
values at the nodes (intersection points) of the grid. Many different interpolation
methods are used in gridding. Most involve some form of weighted average of points
within a specified distance from each grid node (Hamilton and Jones 1992). Con-
tours developed from either type of network may be smoothed, either as part of the
contouring procedure or afterward.
The first decision is whether the contouring will be based on a TIN or on a grid. The
most direct relationship is to connect adjacent points with straight lines, producing a
TIN. This has long been a preferred approach in hand contouring and is also popular
in computer contouring (Banks 1991; Jones and Nelson 1992). The primary advantages
of the method are that it is very fast, the contoured surface precisely fits the data, and
it is easy to do by hand. For structural interpretation, fitting the data exactly, including
the extreme values, is a valuable property, because the extreme values may provide the
most important information. Plotted in three dimensions, the TIN network alone will
show the approximate shape of the surface. The advantage of gridding is that once the