Geology Reference
In-Depth Information
2.3.1
Stereogram
A stereogram (Dennis 1967; Lisle and Leyshon 2004) is the projection of the latitude and
longitude lines of a hemisphere onto a circular graph. Two different projections are com-
monly used in structural interpretation, the equal-area net (Schmidt or Lambert net) and
the equal-angle stereographic net (Wulff net). The different projection techniques result
in the preservation of different properties of the original sphere (Greenhood 1964). The
equal-area net is required if points are to be contoured into spatially meaningful concen-
trations. An equal-angle net produces false concentrations from an evenly spaced distri-
bution of points, although the angular relationships are correct. The lower-hemisphere
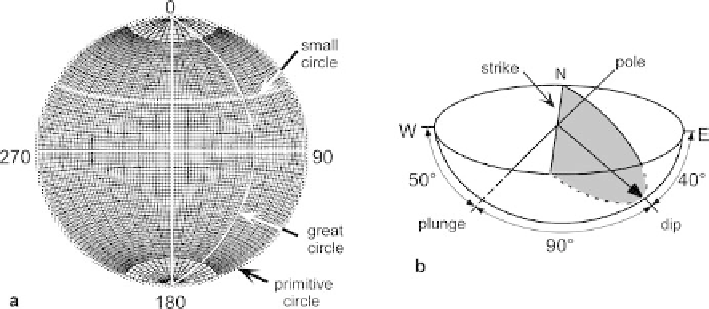
equal-area stereograms (Fig. 2.13a) will be used throughout this topic (an enlarged copy
for use in working problems is given as Fig. 2.28 at the end of the chapter).
The outer or primitive circle of the equal-area stereogram is the projection of a
horizontal plane (Fig. 2.13a). The compass directions are marked around the edge of
the primitive circle. The projections of longitude lines form circular arcs that join the
north and south poles of the graph and represent great circles. The trace of a plane is
a great circle. A line plots as a point. The projections of latitude lines are elliptical
curves, concentric about the north and south poles and represent small circles. The
center of the graph is a vertical line. Planes and lines plotted on a stereogram can be
visualized as if they were intersecting the surface of a hemispherical bowl (Fig. 2.13b).
A stereogram is used with a transparent overlay on which the data are plotted and
which can be rotated about the center of the graph. To begin using a stereogram, on the
overlay, mark the center and the north, east, south, and west directions, and the primi-
tive circle (Fig. 2.14a). To plot the attitude of a plane from the strike and dip (for ex-
ample, 60, 32SE), mark the strike on the primitive circle. Then rotate the overlay so that
the strike direction lies on the N-S axis (Fig. 2.14b), find the great circle corresponding
to the dip by counting down (inward) along the E-W axis from the primitive circle
(zero dip) the dip amount in the dip direction. Draw a line along the great circle and
Fig. 2.13.
Stereogram.
a
Equal-area stereogram (Schmidt or Lambert net), lower hemisphere projection.
b
Visualization of a plane and its pole in a lower hemisphere. (After Rowland and Duebendorfer 1994)