Geology Reference
In-Depth Information
White et al. (1986) gives a best-fit shear angle of 64° antithetic for two different re-
flectors on the same section (Fig. 11.53). Using a depth-migrated version (vertical
exaggeration 1 : 1) of the same seismic line, Rowan and Kligfield (1989) predicted the
rollover geometry using a variety of different shear angles (Fig. 11.54) and found that
the angle that gives best match to the fault shape is 90° (vertical simple shear). This
result demonstrates that an empirical best fit can be obtained in either time or depth
but that finding the “true” shear angle requires a section without vertical exaggera-
tion. The shear angle can compensate for an unknown vertical exaggeration but the
strain related to the geometry and shear angle will only be correct if the shear angle
is determined from an unexaggerated profile.
Additional confidence is obtained in the result if the same angle works for more
than one bed as in both examples above. Statistical curve-fitting can be used to find
the shear angle that minimizes the differences between the fault shapes predicted from
multiple beds and to find the shear angle and shear azimuth in three dimensions (Kerr
and White 1996).
11.7.5.2
Shear Angle from Axial Surface Orientation
The axial surfaces bounding dip domains in the pre-growth stratigraphy are parallel
to the shear direction, a relationship that can be used to determine the shear angle
(Fig. 11.55). Axial surfaces that are not parallel to the shear direction develop in growth
sediments. See Xiao and Suppe (1992) and Spang and Dorobek (1998) for discussions
of the geometry expressed by growth stratigraphy.
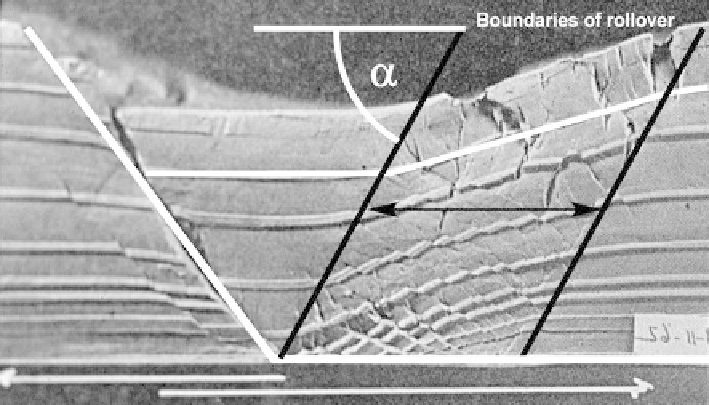
Fig. 11.55.
Shear angle approximated as dip of axial surface (clay model from Cloos 1968, interpreta-
tion after Groshong 1990). The direction of oblique simple shear is given by the
heavy black lines