Geology Reference
In-Depth Information
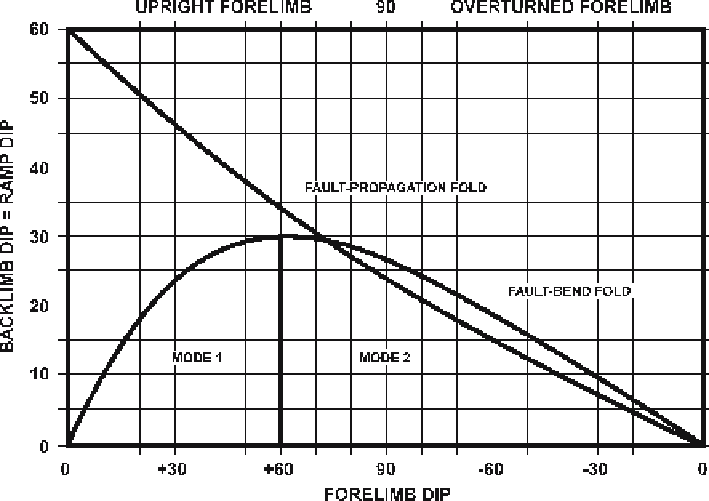
Fig. 11.38.
Graph of forelimb vs. backlimb dips in constant bed thickness fault-bend and fault-propa-
gation folds (Fig. 11.37a,b). The backlimb is always above the ramp
The starting point for a model-based interpretation is to determine which model is
appropriate. Constant BLT fault-bend and fault-propagation folds have analytical re-
lationships between forelimb and backlimb dips that can be expressed graphically. The
graph (Fig. 11.38) is a plot of forelimb dip versus backlimb dip, with the dips being
measured relative to the regional dip outside the fold. A field example can be plotted
on Fig. 11.38 to see if falls on either the fault-bend or fault-propagation fold curve. If
the point falls on one of the lines, then there is a high probability that the fold fits the
model and the model can be used to predict the fold geometry.
As an example of the methodology, the deep structure of the fold in Fig. 11.39a is
interpreted. The regional dip is inferred to be parallel to the planar domain between
the two limbs and is confirmed because the same dip is seen outside the structure. The
limb dips are measured with respect to regional Fig. 11.39a and plotted on Fig. 11.38,
The points fall on the fault-bend fold curve, indicating the model to be used. In
Fig. 11.39b the interlimb angles are measured and bisected to find the axial-surfaces.
The backlimb axial surfaces (1 and 2) are parallel, as are the forelimb axial surfaces
(3 and 4). Beds must return to regional dip outside the anticline, allowing the location
where the forelimb flattens into regional dip (axial surface 4) to be determined. The
fault ramp must be below and parallel to the backlimb (Fig. 11.39c). The exact location
of the fault requires additional information about the position of the lower and upper
detachments. Bed truncations in the forelimb of the hangingwall or against the ramp