Geology Reference
In-Depth Information
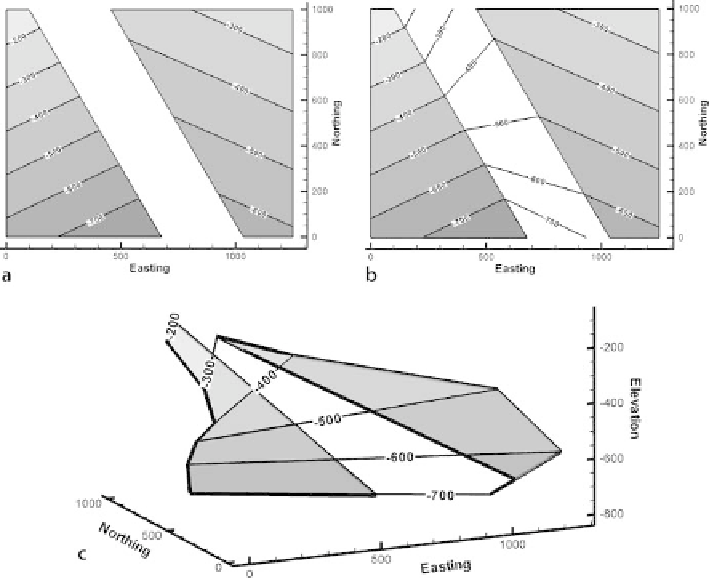
Fig. 10.20.
Interpretation of unlikely fault geometry from implied structure contours.
a
Structure contour
map of offset marker without contours on fault.
b
The implied fault contours found by connecting equal ele-
vations of the hangingwall and footwall bed cutoffs.
c
3-D view to NE showing the implied spiral fault shape
apparent. The map shows the marker bed to be above the fault on both sides of the fault
gap. Normally an offset bed will occur on both sides of the fault. This is not required for
a fault where erosion has removed beds from one side, but otherwise is anticipated.
The 3-D view (Fig. 10.21c) makes it clear that both segments of the marker bed are in
the hangingwall of the fault. Either the map in Fig. 10.21a is wrong or the fault has
truncated a steeply plunging synform, the trough of which has yet to be located. Find-
ing the synclinal hinge of the marker-bed in the footwall would validate the map.
10.5.2
Fault Separation
The stratigraphic separation from a fault cut in a well must agree with the heave and
throw shown by the structure contour map of the faulted surface. Suppose the well
that cuts the normal fault at the location shown in Fig. 10.22 has a stratigraphic sepa-
ration of 75 m, is this consistent with the map? The map indicates a heave of 24.6 m
and a throw of 64.5 m (Sect. 8.2). From Eqs. 8.1 or 8.2, the stratigraphic separation on
the fault should be 47.6 m, a significant difference. The alternative strategy is to find