Geology Reference
In-Depth Information
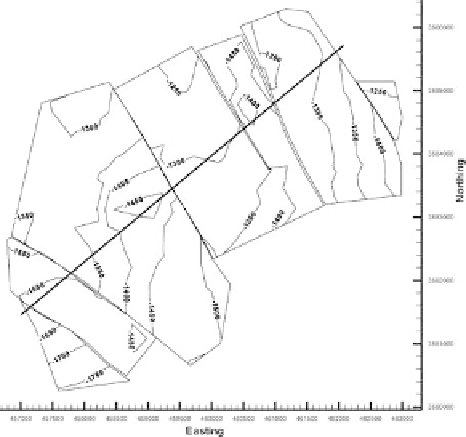
Fig. 10.16.
Top Mary Lee structure contour
map (same data as Fig. 10.14)
after reinterpretation of all
map horizons to include faults.
Easting and northing in meters,
elevations in ft
10.4.3
Realistic Growth History
The growth sediments, deposited during deformation, contain a record of the struc-
tural evolution. The implied evolution must be compatible with the regional struc-
tural style and evolution. Apparent inconsistencies in the indicated geological evolu-
tion may indicate errors in the interpretation. The expansion index plot across a fault
(Sect. 7.7.4) is very helpful in recognizing and fixing this type of problem. The appro-
priate form of the plot is determined from the local structural style. For example, in an
extensional region, a reasonable expectation is that the sense of displacement on nor-
mal faults does not reverse and, consequently, that the expansion index must always be
greater than one. A value of less than one means that the downthrown side received
less sediment than the upthrown side which, in turn, implies that the downthrown side
was high (upthrown) during the interval having an
E
< 1.0. In this situation, an
E
< 1.0
could indicate a miscorrelation, either of the units or of the fault cuts. In Fig. 10.17, if
the top three units are correlated,
E
is less than one in unit 2. A better interpretation is
that the thin unit 2 on the hangingwall is part of a thicker interval that correlates with
unit 2 on the footwall (interpretation 2). Another possibility is that the abnormally thin
unit in well B on the downthrown side of a fault has been truncated by another fault
(Fig. 10.18a). Inserting fault f
2
at the proper location (Fig. 10.18b) results in the correct
form of the expansion-index diagram. The expansion index increases steadily down-
ward for the reinterpreted fault blocks.
The growth history should agree with the stratigraphic separation on the fault. Within
the growth interval on a normal fault, the separation is expected to increase down the
dip. The throw across the fault can be plotted against depth (Fig. 10.18). A misinter-