Geology Reference
In-Depth Information
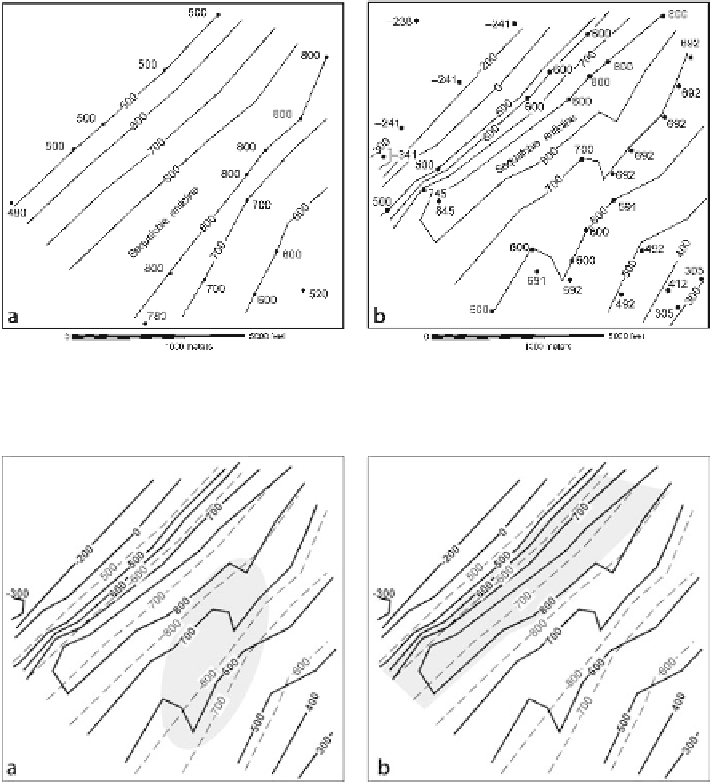
Fig. 10.11.
Structure contours on adjacent horizons. Control points are labeled. Contour interval is 100 ft.
a
Top of the Mpm.
b
Structure contour map on the top of the Mtfp, 108 ft stratigraphically below the Mpm
Fig. 10.12.
Testing for compatible surfaces by superimposing structure contour maps. Structure con-
tour map of the top Mpm (
dashed contours
) overlain on the composite map of the top Mtfp (
solid
contours
).
a
Shaded area
is a zone of contour shape incompatibility.
b
Shaded area
shows approximate
area where the stratigraphically higher surface (Mpm,
dashed lines
) lies below the stratigraphically
lower surface (Mtfp,
solid lines
)
A comparison between elevations of the two maps in Fig. 10.11 reveals a fatal flaw
in the interpretation: the upper stratigraphic surface lies below the lower stratigraphic
surface in the shaded area of Fig. 10.12b. This indicates a glaring lack of compatibility
between the two surfaces. Usually it will be the map with the lesser amount of control
that should be corrected. A cross section would also reveal this problem and make it
easy to visualize, one of the reasons that cross sections should always be part of the
quality control process.