Geology Reference
In-Depth Information
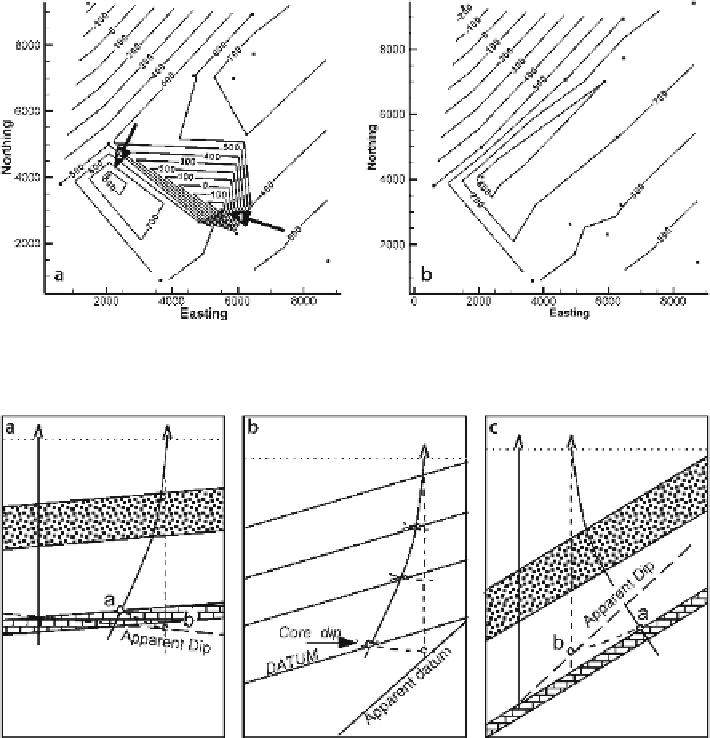
Fig. 10.1.
Locating data errors on a structure contour map.
a
Preliminary map with questionable clo-
sures.
b
Map recontoured after removal of point 1
Fig. 10.2.
False apparent dips caused by unrecognized well deviation.
a
Apparent dip determined between
two wells, one unknowingly deviated down dip.
b
Dip determined from core dip in the unknowingly devi-
ated well.
c
Apparent dip determined between two wells, one unknowingly deviated up dip. (After Low 1951)
and could be real or a bad data point. Removal of point 1 leads to a more structurally
reasonable map (Fig. 10.1b) and shows point 2 to be consistent with the revised map.
Maps produced by triangulation are the best for recognizing data errors because gridded
maps smooth the values and thereby reduce the effect of anomalous values. It is always
worth checking a point that produces a one-point closure. Local closures, if actually
present, are important because, for example, they might form hydrocarbon traps.
Bad points can arise from a deviated well that is mistakenly interpreted as being ver-
tical, causing both location and thickness anomalies. The log depth to a formation boundary
is larger in a well that deviates down dip than in a vertical well at the same surface location
(Fig. 10.2a). If the formation boundary is plotted vertically beneath the well location, its
depth will be too great. If an apparent dip is then determined between this well and a