Geology Reference
In-Depth Information
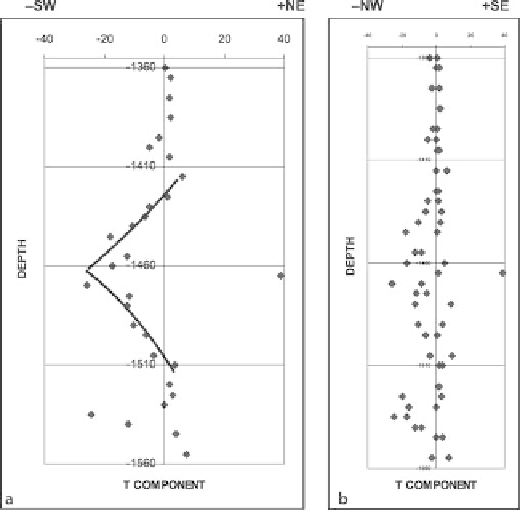
Fig. 9.25.
T
and
L
component plots for
data in Table 9.2, given
T
= 052
and
L
= 322. Plus and minus
values assigned to the compass
directions are for spreadsheet
plotting purposes.
a
T
compo-
nent versus depth.
b
L
compo-
nent versus depth
9.7
Exercises
9.7.1
SCAT Analysis of the Sequatchie Anticline
Use the data in Table 9.1 to perform a complete SCAT analysis on the dip traverse across
the Sequatchie anticline. Plot the azimuth-distance and the dip-distance diagrams. What
are the
T
and
L
directions? What are the dip components in the
T
and
L
directions?
Plot them on the dip-component diagrams.
9.7.2
SCAT Analysis of Bald Hill Structure
Use the data in Table 9.3 to perform a complete SCAT analysis on the dip traverse across
the Bald Hill structure to see if a fault is present and its location and orientation, given
that the faults in the area are reverse.
9.7.3
SCAT Analysis of Greasy Cove Anticline
Perform a complete SCAT analysis on the Greasy Cove anticline (Table 9.4). Consider both
fold and fault geometry. The anticline is part of the southern Appalachian fold-thrust belt.