Geology Reference
In-Depth Information
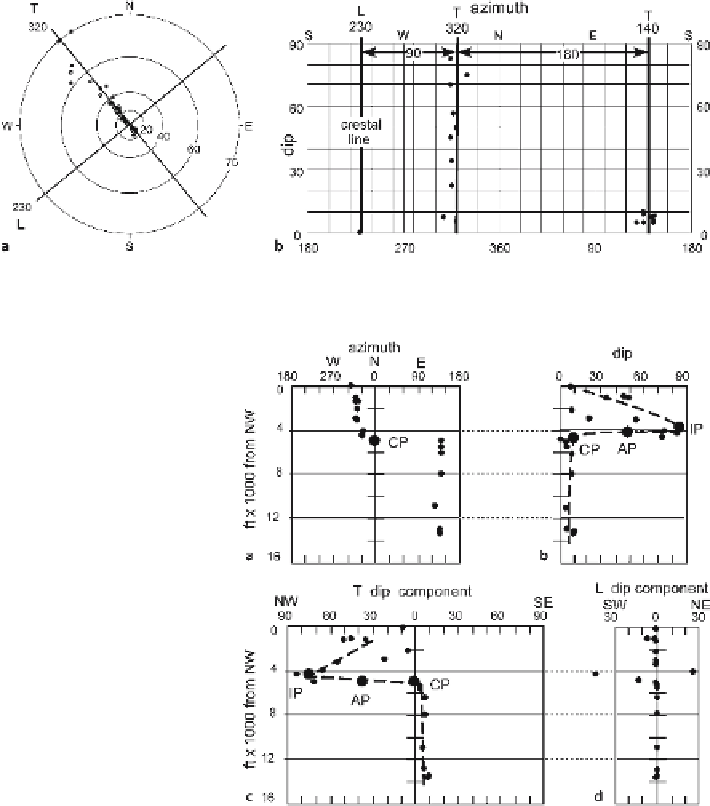
Fig. 9.15.
Finding the
T
and
L
directions for the traverse across the Sequatchie anticline.
a
Tangent dia-
gram.
b
Azimuth-dip diagram.
T
transverse dip direction;
L
longitudinal dip direction; crest line is at 0, 230
Fig. 9.16.
SCAT analysis of the Sequatchie
anticline.
a
Azimuth-distance
diagram.
b
Dip-distance dia-
gram.
c
T
component dip-dis-
tance diagram.
d
L
component
dip-distance diagram.
AP:
axial
plane;
CP:
crestal plane;
IP:
in-
flection plane
Fig. 9.16 with 9.11). The locations of the crestal plane and inflection plane are well
defined in Fig. 9.16b,c and the axial plane falls between the two. Note that in the dip-
depth (distance) plot (Fig. 9.16b) all dips plot to the right, whereas in the
T
-component
plot the dips are plotted by their quadrant direction. The dip data for the northwest
limb is noisy, even on the
T
-component plot, although the signal remains clear. Most
of the dips on the
L
-component diagram (Fig. 9.16d) are zero or close to zero, confirm-
ing the choice of the plunge direction and the interpretation that the plunge is zero.
Significant plunge aberrations occur between the inflection plane and the crest plane
which is the location of the steep limb of the structure. This suggests that the structure
of the steep limb is complex, perhaps containing obliquely plunging minor folds, not
just a simple monoclinal dip or curvature around a single axis.