Geology Reference
In-Depth Information
The potential of the method is indicated by the interpretation of the Railroad Gap oil
field on the basis of the SCAT analysis of a single, favorably located well (Figs. 9.1, 9.2).
SCAT analysis (Bengtson 1981a) was used to predict the structure on perpendicular
cross sections from which the map was generated. The map view shows the close cor-
respondence between the predicted and observed oil-water contact.
9.2
Curvature Models
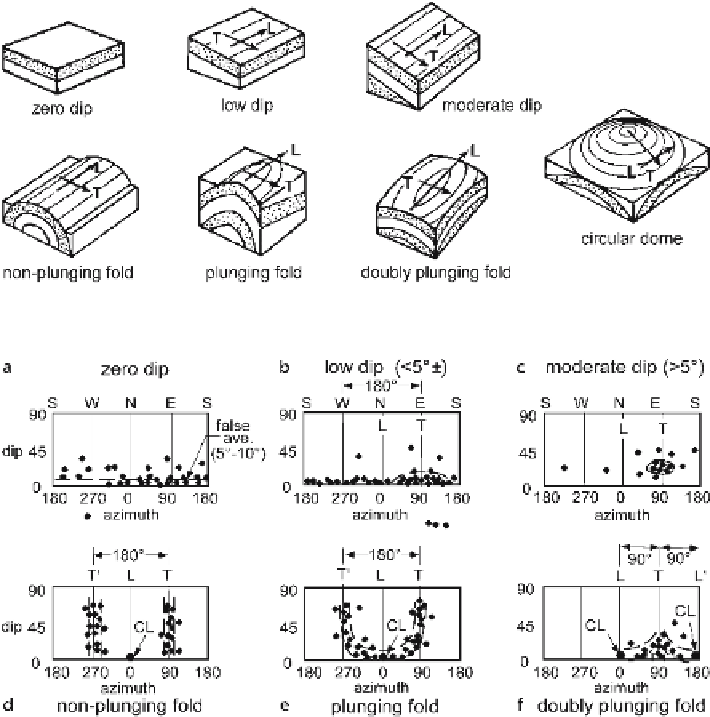
Figure 9.3 illustrates the basic curvature geometries. The first step in the analysis is to
differentiate a monoclinal dip sequence from a fold. This is accomplished with an
azimuth histogram and/or with a tangent diagram. An azimuth histogram is a plot of
the azimuth of the dip versus the amount of the dip (Fig. 9.4). The natural variation of
Fig. 9.3.
Models of structural curvature geometries.
L:
Longitudinal;
T:
transverse. (Bengtson 1981a)
Fig. 9.4.
Dip vs. azimuth patterns corresponding to the models of Fig. 9.3.
CL:
crestal line (after Bengtson
1981a).
a
Zero dip.
b
Low dip.
c
Moderate dip.
d
Non-plunging fold.
e
Plunging fold.
f
Doubly plunging fold