Geology Reference
In-Depth Information
independently. Folds produced by displacement on faults are discussed in Chap. 11.
If a planar fault displaces a pre-existing structure, then the shape of the marker
horizon will be unaffected by the fault (Fig. 8.10c,d) and the two sides should be
contoured so that the hangingwall and footwall bed geometries are related to one
another across the fault. The fault separation, if known, should be used to control
the size of the fault. The next sections describe interpolation techniques designed
to complete the faulted surface based on the different types of information com-
monly available.
8.3.2.1
Extrapolation of Marker Surface to the Fault
The following method is appropriate where there are enough data to define reason-
able marker geometries in the vicinity of the fault. The marker on one side of the
fault is contoured to define its shape (Fig. 8.11a). The marker surface is projected
into the fault to find the line of intersection, known as the cutoff line. In 3-D software
the model can be rotated until the view is along the marker trend and the cutoff line
traced directly onto the fault. If a fold is present, see Sect. 5.2 for defining the fold
trend and Sect. 6.6 for projection techniques. Once the cutoff line has been found it
is added to the marker-horizon data set and contoured (Fig. 8.11b). If comparable
information is available, the same procedure is followed on the opposite side of the
fault to produce the finished map (Fig. 8.12).
Where no information is available about the dip of the fault and the fault sepa-
ration is unknown, the structure contours on the fault surface can be generated
from the fault geometry most reasonable for the local structural style, for example,
a 60° dip for a normal fault. The marker beds are extrapolated from both the
hangingwall and footwall until they intersect the fault. The structure contours on the
hypothetical fault and the extrapolated marker horizon are intersected to produce
the fault trace on the map. The resulting map will be internally consistent but is, of
course, hypothetical.
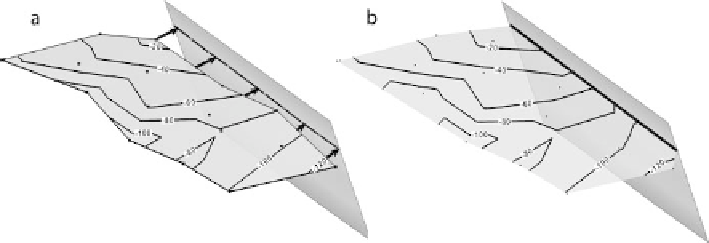
Fig. 8.11.
Projection of a marker surface to a fault plane. The example is the top Gwin of the footwall on
the western fault in Fig. 8.6c.
a
Faulted marker surface is projected along trend (
arrows
) to its intersec-
tion with the fault.
b
Points along the resulting footwall cutoff line are contoured with the original
marker data to produce a surface that accurately meets the fault