Geology Reference
In-Depth Information
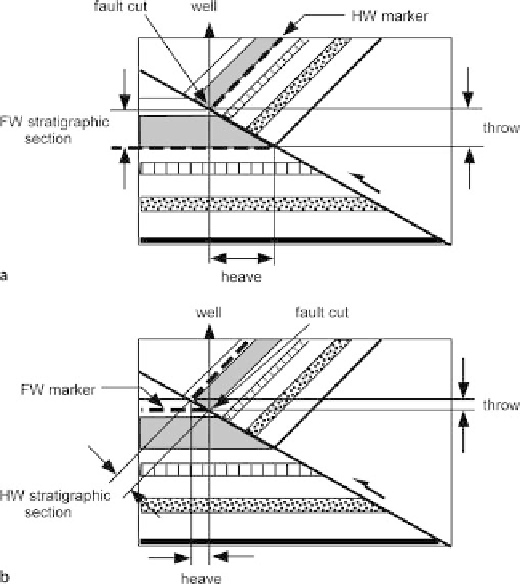
Fig. 7.27.
Identical cross sections of a
growth reverse fault showing
effect of growth on throw and
heave. The section is vertical
and in the direction of fault
dip. The fault cut is at the same
point in both sections.
a
The
fault cutoff of a hangingwall
marker (
dashed
) is extrapo-
lated to the footwall cutoff of
the same marker using dip
and thickness values from the
footwall.
b
The fault cutoff of
a footwall marker (
dashed
) is
extrapolated to the hanging-
wall cutoff of the same marker
using dip and thickness values
from the hangingwall
graphic section. The same considerations apply to the correct choice of thickness for
growth reverse faults (Fig. 7.27).
7.6.2
Expansion Index
The growth history of a fault can be illustrated quantitatively with the expansion
index (
E
) of Thorsen (Fig. 7.28):
E
=
t
d
/
t
u
,
(7.10)
where
t
d
= the downthrown thickness (hangingwall) and
t
u
= the upthrown thickness
(footwall). The thicknesses should be measured perpendicular to bedding so as not to
confuse dip changes with thickness changes, and as close to the fault as possible be-
cause that is where the maximum thickness changes occur.
The simplest possible growth fault is one that starts, increases in growth rate, then
slows and stops (Fig. 7.28). In the pre-growth interval,
E
= 1.0 (unit j); as the growth
rate increases, so does the expansion index, to a maximum of 2.1 in Fig. 7.28. The growth
of the fault slows and eventually stops and
E
returns to 1.0 (unit a). The plot of
stratigraphic interval versus expansion index gives a visual picture of the growth his-