Geology Reference
In-Depth Information
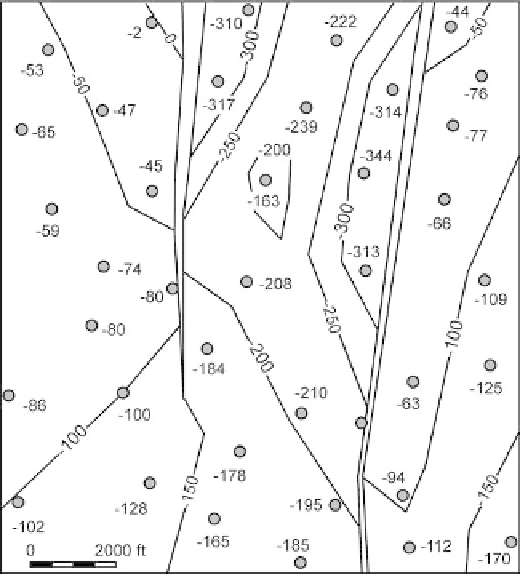
Fig. 6.54.
Structure contour map of the
top of the Gwin coal cycle.
Elevations of the top Gwin are
posted next to the wells. Units
are in feet, negative below sea
level
6.9.4
Illustrative Cross Section from a Structure Contour Map 2
Draw cross sections along the three lines indicated on Fig. 6.55. Using the fault dip
determined from the map, extend the faults above and below the marker horizon until
they intersect. Which fault(s) formed last?
6.9.5
Illustrative Cross Section from a Structure Contour Map 3
Draw cross sections along the three lines indicated in Fig. 6.56. Determine the dips of
the faults from the map and then extend the faults above and below the marker hori-
zon until they intersect. Which fault is youngest?
6.9.6
Predictive Dip-Domain Section
Complete the cross section in Fig. 6.57 by extending it into the air and deeper into the
subsurface. How far can the section be realistically extended?