Geology Reference
In-Depth Information
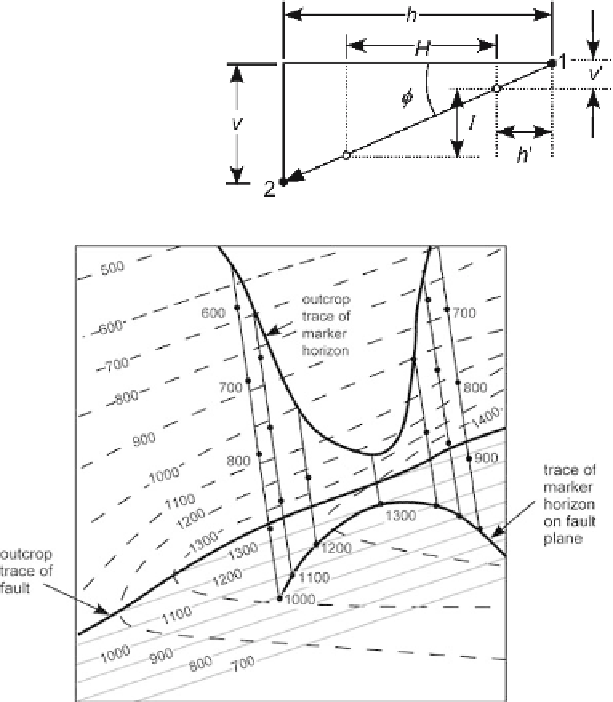
Fig. 6.38.
Projection along plunge in a
vertical cross section. The
projection is parallel to plunge
along the plunge line from
point
1
to point
2
.
Open circles
are spot heights along the
plunge line. For explanation
of symbols, see text
Fig. 6.39.
Projection of a marker horizon to a fault plane along plunge lines.
Dashed lines
are topo-
graphic contours above sea level.
Dotted lines
are subsurface structure contours on the fault. Plunge
lines are
solid
and marked by spot elevations. (After De Paor 1988)
where
H
= horizontal spacing of points,
I
= contour interval, and
=plunge. If the
control point is not at a spot height, the distance from the control point to the first spot
height is
φ
h
'=
H
v
'/
I
,
(6.12)
where
h
' = the horizontal distance from the control point to the first spot height and
v
' = the elevation difference between the control point and the first spot height.
Projection along plunge lines is particularly suited to projecting data from an ir-
regular surface, such as a map, onto a surface, such as a cross section or fault plane,
that itself can be represented as a structure-contour map. Figure 6.39 shows plunge
lines derived from a map of a folded marker horizon on a topographic base. The fold