Geology Reference
In-Depth Information
a mental and physical picture of the structure in three dimensions. The best interpre-
tations utilize the constraints provided by all the data in three dimensions. The most
complete interpretation would be as a three-dimensional solid, an approach possible
with 3-D computer graphics programs. Two-dimensional representations of structures
by means of maps and cross sections remain major interpretation and presentation
tools. When the geometry of the structure is represented in two dimensions on a map
or cross section, it must be remembered that the structure of an individual horizon or
a single cross section must be compatible with those around it. This topic presents
methods for extracting the most three-dimensional interpretive information out of
local observations and for using this information to build a three-dimensional inter-
pretation of the whole structure.
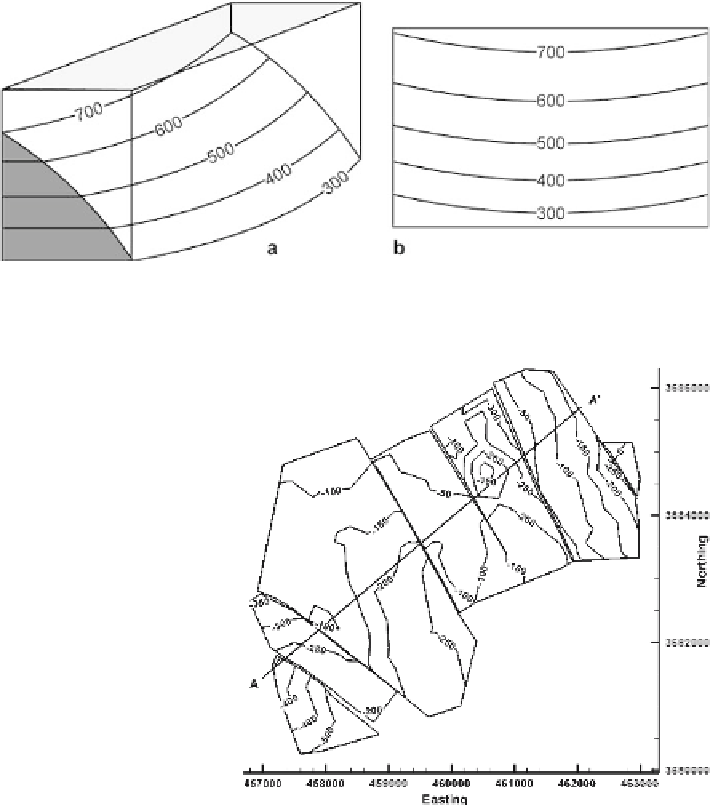
Fig. 1.2.
Structure contours.
a
Lines of equal elevation on the surface of a map unit.
b
Lines of equal
elevation projected onto a horizontal surface to make a structure contour map
Fig. 1.3.
Structure contour map of the
faulted upper horizon from
Fig. 1.1. Contours are at 50 ft
intervals, with negative eleva-
tions being below sea level.
Faults are indicated by gaps
where the horizon is missing