Geology Reference
In-Depth Information
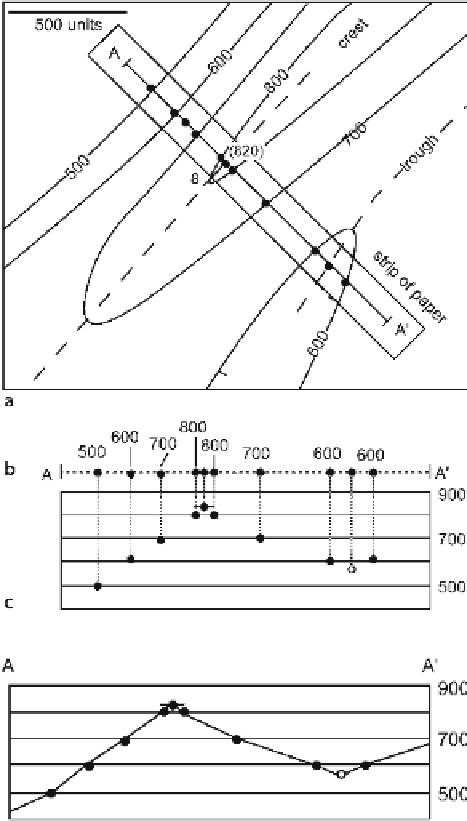
Fig. 6.12.
Transferring data from map to
cross section using an overlay
(
dashed line
).
a
Data points
are marked on the overlay.
b
The overlay is aligned with
the section.
c
Points are pro-
jected onto the section (
dotted
lines
).
Filled circles
are pro-
jected from known elevations;
the
open circle
is an interpo-
lated elevation
Fig. 6.13.
Cross section
A
-
A'
from the
structure contour map of
Fig. 6.12. Vertical section, no
vertical exaggeration. The
short horizontal line
is the
apparent dip from the bed-
ding attitude on the map
data onto the profile, it should be checked. Then the profile is constructed by connect-
ing the dots (Fig. 6.13). If the correct shape of the profile is not clear, points can be
added by interpolation between contours on the map.
6.3.2
Slicing
With 3-D software a cross section can be constructed by slicing the 3-D model (Fig. 6.14).
The slice automatically shows the apparent dips of beds and faults, contact locations,
and the apparent thicknesses of the beds.