Geology Reference
In-Depth Information
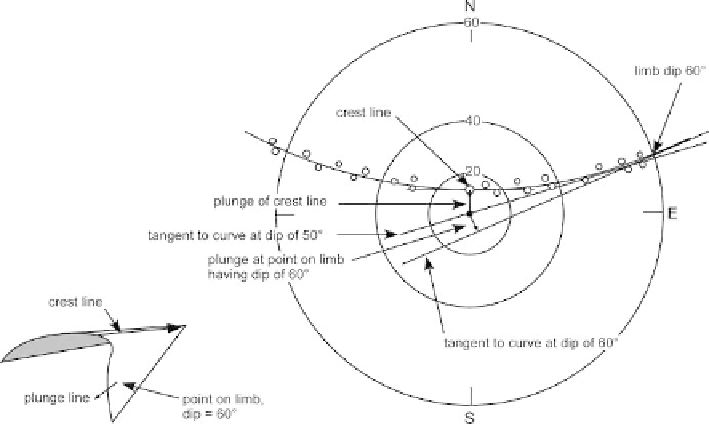
Fig. 5.7.
Projection directions in a type II conical fold
persion of the steep dips. It is primarily the positions of the more gently dipping points
that control the location of the axis and its plunge. The stereogram is the best method
for fold axis determination for folds which contain mainly very steep dips.
5.2.3
Tangent Diagram on a Spreadsheet
Plotting dips on a tangent diagram is readily accomplished using a spreadsheet, which
then allows the spreadsheet curve-fitting routines to be used to find the best-fit line or
curve through the data. The following procedure allows a tangent diagram to be plot-
ted as a simple
xy
graph on a spreadsheet. To place north (zero azimuth) at the top of
the page, shift the origin with
Az = Az - 90 ,
(5.1)
where Az = azimuth of the dip. Change the dip magnitude to the tangent of the dip with
r
=tan(
δ
) ,
(5.2)
where
r
= radius and
δ
= dip magnitude. Then change from polar to Cartesian coor-
dinates with
x
=
r
cos Az ,
(5.3a)
y
=
r
sin Az .
(5.3b)