Geology Reference
In-Depth Information
or errors in the dip may appear as thickness anomalies. An isopach map is a map of
the true thickness of the unit (
t
, Fig. 4.1) measured normal to the unit boundaries (Bates
and Jackson 1987). An isocore map is defined as a map of the vertical thickness of a
unit (
t
v
; Fig. 4.1; Bates and Jackson 1987). The drilled thickness in a deviated well
(
t
s
, Fig. 4.1) will usually differ from either the true thickness or the vertical thickness.
It is not possible to correct the thickness in a deviated well to the vertical thickness or
to the true thickness without knowing the dip of the bed. The thickness differences
resulting from the different measurement directions are not large for nearly horizon-
tal beds cut by nearly vertical wells, but increase significantly as the relationships de-
parts from this condition. The effects of stratigraphic and dip variations on thickness
maps are considered here. The effect of faults on isopach maps are discussed in Sect. 8.5.
4.3.1
Isopach Maps
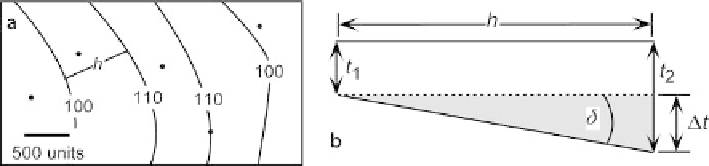
An isopach map is used to show thickness trends from measurements at isolated points
(Fig. 4.13a). An isopach map can be interpreted as a paleotopographic map if the up-
per surface of the unit was close to horizontal at the end of deposition. If the paleo-
topography was controlled by structure, then it can be considered to be a paleostructure
map. The thickness variations represent the structure at the base of the unit as it was
at the end of deposition of the unit. The trend of increased thickness down the center
of the map in Fig. 4.13a could imply a filled paleovalley.
The slope of the base of the paleovalley can be determined from the thickness dif-
ference and the spacing between the contours according to the geometry of Fig. 4.13b:
δ
=arctan(
∆
t
/
h
) ,
(4.17)
where
t
= the difference in thickness between two contours, and
h
=the
horizontal (map) distance between the contours, measured perpendicular to the con-
tours. For the map in Fig. 4.13a, the slope implied for the western side of the paleovalley
is about 0.5° (
δ
= the slope,
∆
900). Stratigraphic thickness variations could be caused by
growing structures. The dip calculated from an isopach map using Eq. 4.17 could rep-
resent the structural dip that developed during deposition. According to this interpre-
tation, Fig. 4.13a could represent a depositional syncline.
∆
t
= 10,
h
≈
Fig. 4.13.
Paleoslope from thickness change.
a
Isopach map.
Dots
are measurement points;
h
is the lo-
cation of a cross section.
b
Cross section perpendicular to the trend of the thickness contours, inter-
preted as if the upper surface of the unit were horizontal