Information Technology Reference
In-Depth Information
a
b
low value of
y
high value of
y
c
ψ
;
1
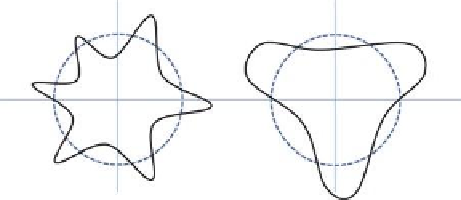
Fig. 7.13
Typical
ppr
contours (
solid lines
) for (
a
) a low value of
ψ
, (
b
) a high value of
1
ψ≤
, the ratio
y
acquires the geometrical explanation of being approximately equal to the
angle in radians, as observed at the transmitting node, of the “typical width” of its regions, where
d
>
d
50%
=
R
= 70 m for its
ppr
= 0.5 contour, since
1
(
c
) For
1
c
ψ
=
LR
/
=
2sin
1
2
ϕ ϕ ϕ≤
(maxi-
»
for
mum error of 4%)
deterministic functions of distance from the transmitter), 6 and 8 dB, which are the
typical reported values in [
4
].
The simulations are performed as follows: The source node is always chosen to
be the node with the minimum x-coordinate value and the destination node is
always chosen to be the node with the maximum x-coordinate value throughout the
simulations. The average hop count over 12 independent network topology realiza-
tions per node density is computed, together with standard error bars to show the
spread of values. The results of the simulations are shown in Figs.
7.14
-
7.16
. The
greedy algorithm has a hop count close to the optimal (found by Dijkstra's
algorithm); local knowledge prevents it from finding always an optimal path, and
sometimes it does not find a path at all in a connected network. Furthermore, the
performance of the unrealistic
=σ
model is,
on average
, expected to be the
same as that of the greedy algorithm on UDG and this is in good agreement with
the results of Figs.
7.14
-
7.16
given that only 12 ensemble realizations are used to
compute averages.
It is clear from the simulations that there exist certain combinations of values of
y
,
k
and
d
σ
, where the performance of the probabilistic progress localized routing
algorithm with a realistic physical layer is significantly better than the corresponding
performance predicted by greedy algorithm applied on both the UDG and the
unrealistic
0 dB
dB
σ
=
0 dB
models.
dB

Search WWH ::

Custom Search