Information Technology Reference
In-Depth Information
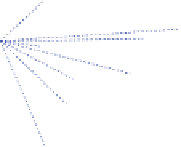
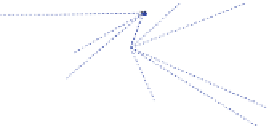
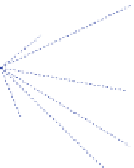
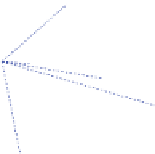
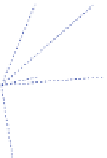
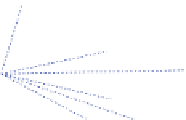
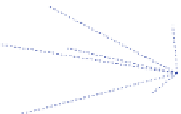
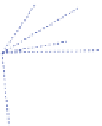
Probabilistics routing in an area of 200
×
200 in metre square
200
1
9
20
1
0
Nodes
Paths b/w nodes
4
5
3
4
4
8
180
2
2
6
47
160
1
8
3
4
2
7
2
4
49
1
1
3
2
140
4
0
41
15
1
7
2
5
120
3
3
4
3
100
5
3
1
3
7
1
6
2
1
50
80
1
3
1
4
1
2
60
9
2
8
23
0
8
39
40
3
3
6
3
8
1
4
2
3
6
20
2
2
4
6
2
7
4
4
0
0
20
40
60
80
100
120
140
160
180
200
Distance in X-axis in metres
Fig. 7.10
Probabilistic model showing next forwarding hops (s = 0) in an area of 200 × 200 m
2
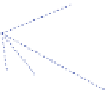
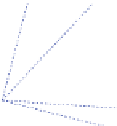
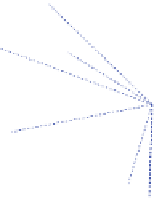
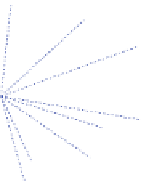
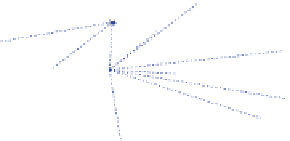
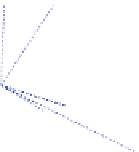
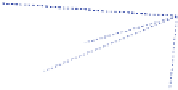
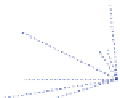
Probabilistics routing in an area of 200
×
200 in metre square
200
1
20
1
0
Nodes
Paths b/w nodes
4
5
3
4
4
8
180
2
6
4
7
160
1
8
3
4
2
7
2
4
49
1
1
3
2
140
1
5
4
0
41
1
7
2
5
120
33
4
3
100
5
31
3
7
16
21
50
80
1
3
1
4
1
2
60
9
2
8
23
0
8
39
40
35
36
3
8
1
4
2
3
6
20
22
4
6
2
7
4
4
0
0
20
40
60
80
100
120
140
160
180
200
Distance in X-axis in metres
Fig. 7.11
Probabilistic model showing next forwarding hops (
s
= 6 dB) in an area of 200
×
200 m
2
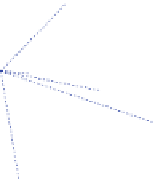
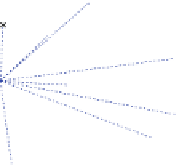
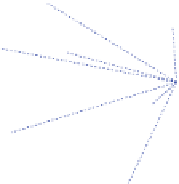
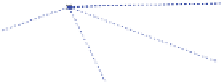
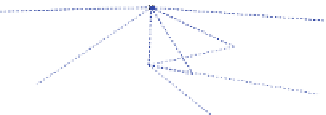
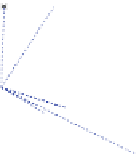
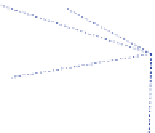
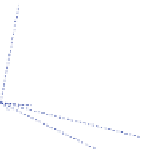
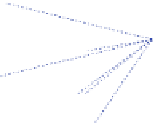
7.7.3
Proposed Model When Standard Deviation (
s
) of Shadow
Fading is Eight Decibels
The two metrics that have been calculated on the proposed model with
s
= 8 dB are
the “
Network Density
” and the “
Hop Count.
” The network density in this case is
14.90 nodes per UDG area and the hop count is 3 (Fig.
7.12
).


Search WWH ::

Custom Search