Database Reference
In-Depth Information
INSERT
INTO
census
.
hisp_pop
(
@
tcols
)
SELECT
@
tload
FROM
census
.
facts
WHERE
fact_type_id
IN
(
@
fact_types
)
AND
yr
=
2010
GROUP
BY
tract_id
;
The lesson to take away from
Example 4-2
is that you can dynamically append SQL
fragments into a variable.
Graphical Explain
One of the great gems in pgAdmin is its at-a-glance graphical explain of the query plan.
You can access the graphical explain plan by opening up an SQL query window, writing
a query, and clicking the explain icon (
).
If we run the query:
SELECT
left
(
tract_id
,
5
)
As
county_code
,
SUM
(
hispanic_or_latino
)
As
tot
,
SUM
(
white_alone
)
As
tot_white
,
SUM
(
COALESCE
(
hispanic_or_latino
,
0
)
-
COALESCE
(
white_alone
,
0
))
AS
non_white
FROM
census
.
hisp_pop
GROUP
BY
county_code
ORDER
BY
county_code
;
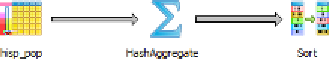
we will get the graphical explain shown in
Figure 4-16
. Here's a quick tip for reading
the graphical explain: trim the fat! The fatter the arrow, the longer a step takes to com‐
plete.
Figure 4-16. Graphical explain example
Graphical explain is disabled if Query→Explain→Buffers is enabled. So make sure to
uncheck buffers before trying a graphical explain. In addition to the graphical explain,
the Data Output tab shows the textual explain plan, which for this example looks like:
GroupAggregate (cost=111.29..151.93 rows=1478 width=20)
Output: ("left"((tract_id)::text, 5)), sum(hispanic_or_latino),
sum(white_alone), ...
-> Sort (cost=111.29..114.98 rows=1478 width=20)
Output: tract_id, hispanic_or_latino, white_alone,
("left"((tract_id)::text, 5)) Sort Key: ("left"((tract_id)::text, 5)) ->
Seq Scan on census.hisp_pop (cost=0.00..33.48 rows=1478 width=20) Output:
tract_id, hispanic_or_latino , white_alone, "left"((tract_id)::text, 5)