Biomedical Engineering Reference
In-Depth Information
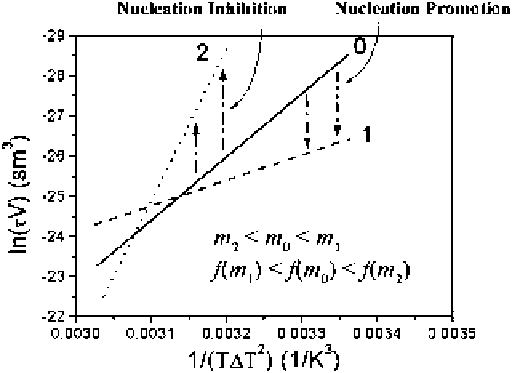
Fig. 2.11
Illustration of the effect of
m
on the nucleation kinetics. The increase of
m
will lower the
interfacial effect parameter
f
and the slope of ln(
V
)
1/(
T
T
2
) and vice versa. Reprinted with
permission from ref. [
54
]. Copyright (2003) the American Society for Biochemistry and Molecular
Biology
and
f
!
0. Since for a given nucleation system, K is constant under a given condition
(see (
2.26
)and(
2.27
)), such a change can then be identified from the lowering of
the slope and the increase of the intercept of ln(
V
)
1/(
T
T
2
)plot(cf.(
2.26
)).
The shift from curve 0 to curve 1 in Fig.
2.11
illustrates this change. Conversely, if
the adsorption of additives leads to a stronger repulsion and an interfacial structure
mismatch between the substrate and the nucleating phase, one has then
m
!
1and
f
!
1. This corresponds to an increase in the nucleation barrier (cf. (
2.15
)). The
effect can be identified from the increase in the slope
f
(
m
)ofln(
V
)
1/(
T
T
2
)
and the decrease of the intercept (from line 0 to line 2 in Fig.
2.11
).
2.2.2.4
Surface Kinetics on Ice Nuclei
Apart from overcoming the nucleation barrier, the nucleation of ice is also affected
by the incorporation of H
2
O molecules onto the surface of ice nuclei at the kink
sites. The rate of kink kinetics is described by ˇ
kink
. ˇ
kink
is associated with
kink
,
the energy barrier to be overcome in order to remove other molecules adsorbed at
the kink sites, and is given by
exp.
G
kink
=kT /:
ˇ
kink
(2.28)
Obviously, the adsorption of additives on the surface of ice, in particular at the
kink sites, will enhance
kink
by .G
kink
/
G
#0
kink
G
kink
:G
#0
kink
denotes
the kink kinetics barrier attributed to the adsorption of impurities/additives on the
D