Biomedical Engineering Reference
In-Depth Information
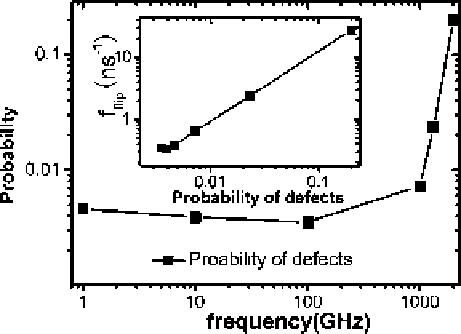
Fig. 1.24
Probabilities of
defects vs. vibration
frequency
f
and (inset) f
flip
with respect to the
probabilities of defects
(reprinted from [
130
].
Copyright 2008 Chinese
Physics Society)
frequency of flip is limited for f<f
c
, which results from the stability of the
whole water chain confined inside the CNT. As
f
becomes larger than
f
c
, the flipping
frequency increases sharply. The hydrogen bond near the middle part of water chain
is usually broken due to violently vibrating, which induces hydrogen bond defects
in the middle portion of the CNT, not only in the inlets of the nanotube.
The dipole flip of ordered water chain inside the CNT is the process that a
hydrogen-bonding defect moves through the tube. Figure
1.24
gives the probability
of defects (corresponding to transition states) with respect to the vibrating frequency
and the relationship between the dipole flipping frequency and the probability
of defects. Similar to the above results, for f<f
c
, the effect of the vibrating
fluctuation on the formation of defects is slight. As frequency grows above
f
c,
the
probability of defects increases dramatically. Correspondingly, the dipole flipping
frequency increases sharply. From simulation results shown in the inset of Fig.
1.24
,
we find that the function f
flip
D
f
flip
C
A
P can fit the data quite well, where
P
is
the probability of defects in water chain, f
flip
D
0:36ns
1
,and
A
is 139.47 ns
1
.
The above sections have discussed the effects of the geometrical shape on the
transportation of water molecules through the nanochannels by deforming the CNT.
Simulation results indicate that pressing the middle part of the CNT by external
force can control the transportation of water chain well. Now we focus on discussing
the effects of the position of the controllable region on water transportation.
The simulation framework is shown in Fig.
1.25
. In order to explore the effect of
the position of the narrow region on water transportation, one carbon atom (the
forced-atom) is pushed away from its initial position, resulting in 2.2
˚
Aradial
displacement in each simulation system. Seven different systems are considered by
choosing different forced-atoms (spheres of the nanotube shown in Fig.
1.25
). For
the convenience of analysis, the middle carbon atom is taken as the origin point of
the
z
axis, and the distance between the forced-atoms and origin point is denoted by
d
. The positions of forced-atoms indexed from 1 to 7 are
7.4,
4.9,
2.5, 0, 2.5,
4.9 and 7.4 A, respectively.