Biomedical Engineering Reference
In-Depth Information
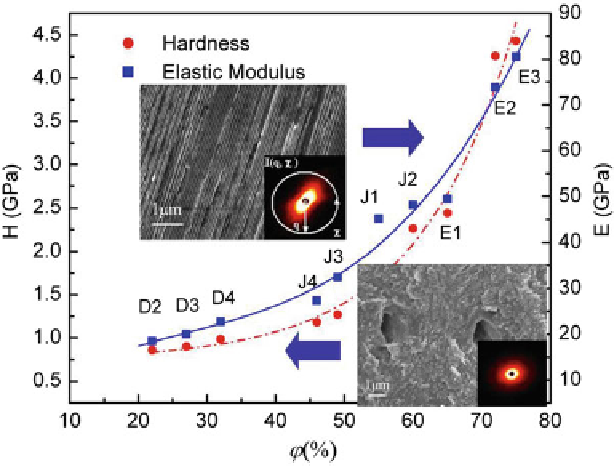
Fig. 7.11
Quantitative correlation between mechanical properties and local alignment of minerals
within the dental sample. Hardness versus alignment. Elastic modulus versus alignment. The
solid circles
and the
hollow circles
represent data measured from dental enamel and dentin,
respectively.
is an ordering parameter measured by small angle X-ray scattering. For a completely
aligned assembly of crystallites,
®
® D
100%, while for a completely disordered assembly,
® D
0.
Reproduced with permission from Ref. [
83
] ©2005 American Institute of Physics
Now, the key question to be addressed is how this parallel packing structure in
the bundle of crystallites occurs. One of the well-accepted interpretation is
the self-
epitaxial nucleation-induced assembly
and the
supersaturation-driven interfacial
structural mismatch
[
9
,
76
,
84
-
86
].
A typical example of
the self-epitaxial nucleation-induced assembly
and the
supersaturation-driven interfacial structural mismatch
is illustrated in Fig.
7.13
a.
As shown, in a solution growth, calcite crystals evolve from single crystals to poly-
crystals with supersaturation. At relatively low supersaturations, the polycrystals
are well aligned with each other. The polycrystallites altogether form a well-
aligned crystallites assembly. This is the so-called
self-epitaxial nucleation-induced
assembly
. As with further increase in supersaturation, the structural match between
the adjacent crystallites in the assembly is lost, giving rise to the
supersaturation-
driven interfacial structural mismatch
(Fig.
7.13
a).
Before going into the details of the model, let us first review the relevant
nucleation processes. Kinetically, the occurrence of substrates in heterogeneous
nucleation will on one hand lower the nucleation barrier thus leading to an increase
in the nucleation rate, but on the other hand it will exert a negative impact on the
surface integration. Nucleation on a substrate will reduce the effective collision
of structural units to the surface of clusters (cf. Fig.
7.3
c), where the structural