Biomedical Engineering Reference
In-Depth Information
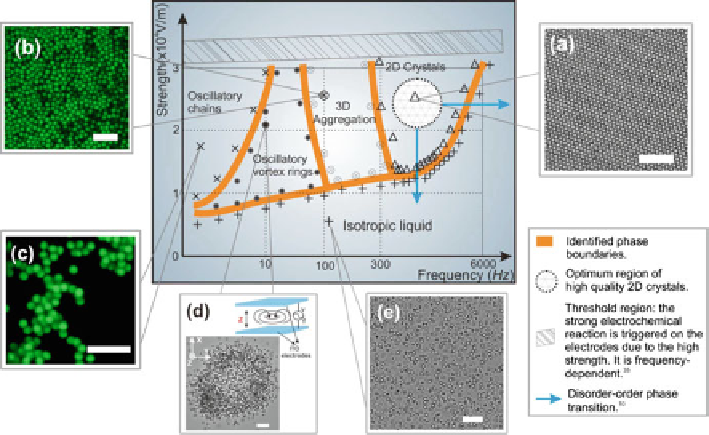
Fig. 7.1
The diagram of electrically controlled colloidal assembly. The phase diagram and typical
colloidal patterns induced by an AEF at room temperature. (
a
) A 2D colloidal crystal at field
strength
10
4
E
D
2.6
V/m and
f
D
800 Hz. (
b
) 3D aggregation of colloidal particles, as captured
10
4
by the LCSM at
E
D
2.4
V/m and
f
D
100 Hz. (
c
) Static snapshot of colloidal chains by
10
4
the LCSM at
E
D
1.8
V/m and
f
D
0.1 Hz. (
d
) Snapshot of oscillatory vortex rings at
10
4
2.3
1Hz.(
e
) The isotropic liquid state of colloidal suspension. Scale bars in
(
b
)and(
c
)represent5
V/m and
f
D
m. Colloidal suspension (0.1%
in volume fraction) of monodisperse charged polystyrene spheres (1
m, and in (
a
), (
d
), and (
e
) represent 10
m in diameter) is confined
to a horizontal layer between two conductive glass microscope slides. Glass spacers set the layer
thickness in the cells at 2
H
1.5 cm observation area. The AEF
was supplied by a waveform generator. The motions of the colloidal particles are recorded with a
computer-driven digital CCD camera. Reprinted with permission from Ref. [
45
] ©2009 American
Institute of Physics
D
120
˙
5
m across the 1.5 cm
ambient
i
between the chemical potentials of a growth unit in the ambient phase
and
in the crystalline phase
crystal
:
ambient
D
i
crystal
(7.2)
where subscript
i
denotes the solute in the ambient phase. When
0, the
system is said to be supersaturated. This is the thermodynamic precondition for
crystallization. Conversely, when
>
0, the system is undersaturated. Under
such a condition, crystals will dissolve. When
<
D
0, the ambient phase is in
equilibrium with the crystalline phase. As for temperature
T
and pressure
P
, one has
.
ambient
i
/
eq
D
crystal
,
where
.
ambient
i
/
eq
is the chemical potential of a solute molecule
in a state of phase equilibrium. Then for crystallization from solutions, the chemical
potential of species
i
is given by [
49
,
50
]
i
D
i
C
kT
a
i
i
C
kT
ln
ln
C
i
(7.3)