Biomedical Engineering Reference
In-Depth Information
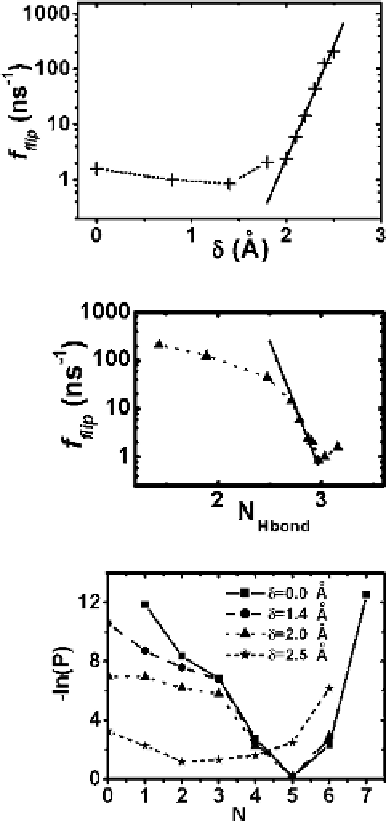
Fig. 1.10
Dependence of
flipping frequency
f
flip
on the
number of hydrogen bonds
N
Hbond
;the
solid line
is the
fits for the exponential decay
vs.
N
Hbond
(reprinted from
[
40
]. Copyright 2005
American Chemical Society)
Fig. 1.11
Dependence of
flipping frequency
f
flip
on ı.
The
solid line
is the fit for the
exponential growth vs. ı
(reprinted from [
40
].
Copyright 2005 American
Chemical Society)
Fig. 1.12
Relative free
energy depends on water
occupancy,
ˇF .N /
D
ln p.N /,for
0.0, 1.4, 2.0, and 2.5 A
(reprinted from [
40
].
Copyright 2005 American
Chemical Society)
ı D
ranges, i.e., 15
ı
<
N
<50
ı
and 130
ı
<
N
< 165
ı
. However, in the interval of
2.0 A
ı<2.5 A, the exponential function f
flip
/
exp.
f
ı
g
=
f
g
/ with
D
0.107
can fit the data very well (Fig.
1.11
).
In order to show the water occupancy fluctuations, the free energy depends on
water occupancy
N
as shown in Fig.
1.12
. This relative free energy can be calculated
by ˇF .N /
D
ln p.N /,where
p
(
N
) is the probability of finding exactly
N
water
molecules inside the nanotube. To obtain good statistics, data are collected every
0.25 ps in the calculation of
p
(
N
). An approximate Gaussian occupation fluctuation
is found for ı
D
0. The free energies for ı
D
1.4 A and 2.0 A are similar to those
for ı
D
0. However, three events have been found with
N
D
7forı
D
0 while none