Biology Reference
In-Depth Information
B
C
A
CW image
ex vivo
FL lifetime maps
0.75
p
<
0.0
5
FL
ns
0.9
0.70
Heart
*
0.65
0.8
0.7
0.60
0.6
0.55
Liver
0.5
0.4
0.50
0.45
0.3
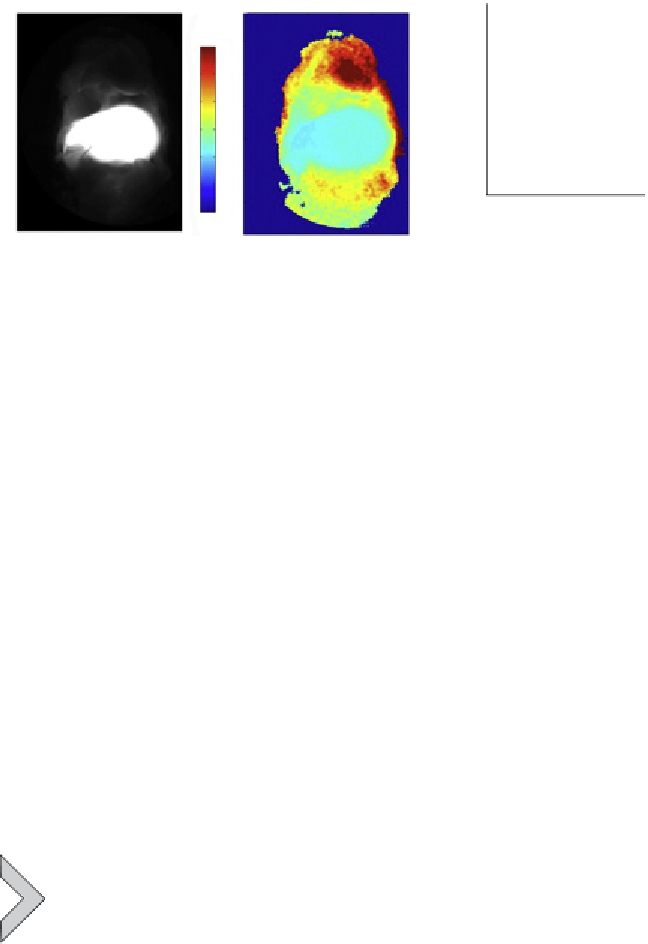
Figure 9.6 Fluorescence lifetime contrast imaging versus fluorescence intensity
changes in experimental myocardial infarction in situ. (A) The image taken by using tra-
ditional continuous wave fluorescence excitation demonstrates high levels of liver fluo-
rescence that obscure fluorescence in the heart. (B) Lifetime maps showing that longer
lifetime fluorescence comes only from infarcted myocardium. (C) The thoracic lifetime
increase in mice with myocardial infarction, which is significantly higher than in hepatic
areas of control or experimental mice (p<0.05).
the IRDye 800CW dye conjugated to PGC (PGC-800,
Table 9.2
), as this
dye fluorescence can be excited farther in the NIR range, thus decreasing
excitation and emission light scattering and nonspecific absorbance of light.
The measurements of PGC-800 activation in the area of experimentally in-
duced myocardial ischemia showed that, despite very low changes in fluo-
rescence intensity compared to that in the liver area (see
Fig. 9.6
A), the
differences in lifetimes were clearly detectable using FL maps (
Fig. 9.6
B).
These results demonstrate the benefits of FLI in which the signal difference
detected between different tissue compartments (liver and heart) is not sen-
sitive to the local concentration of dye in these organs. As a result, we were
able to measure statistically significant changes of FL in the regions affected
with myocardial ischemia and the inflammation that followed the infarction
(see
Fig. 9.6
C).
10. CONCLUSIONS
Optically “silent” macromolecular imaging probes that undergo
enzyme-mediated activation
in vivo
are rapidly becoming essential tools in
basic and applied biomedical research, and several of
these are now


Search WWH ::

Custom Search