Biology Reference
In-Depth Information
A
B
480 nm
SH2
SH3
Y
SH3
YFP
SH2
SH3
Y
SH3
CFP
207
440 nm
YFP
+ BCR-ABL
+ TKI (IM)
+ BCR-ABL
-BCR
-ABL
530 nm
CFP
+ BCR-ABL
FRET
P
P
Y
SH3
CFP
Y
SH3
440 nm
450
500
550
600
(nm)
C
E
Transfection
Amaxa
®
programT -20
solution V
BMB or
PBMC
Density-gradient
centrifugation
2.0
Plasma
mononuclear cells
including
1.5
CML cells
Lymphoprep
®
(~5 ml)
RBC, granulocyte
(-)
IM
1.0
Image acquisition
Data analysis
0
4
8
12
Drug treatment
in 96 well-plate
Time after treatment (h)
D
24 h
Drug efficacy evaluation
1.0
3
Drug sensitive
Drug resistance
0.8
Drug resistance
0.6
D-FRET
2
Drug response
0.4
FRET
WB
0.2
1
0
TKI (
-
)
TKI (+)
TKI (
-
)
TKI (+)
-
3
-
2
-
10 1 2 3
0
Log ([IM (
m
M)])
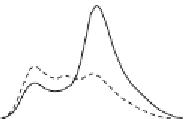
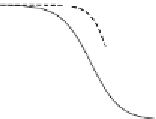
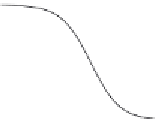
Figure 8.5 Clinical application of the FRET biosensor Pickles. (A) Structure of CrkL and its
change in response to Tyr207 phosphorylation by BCR-ABL. (B) Structure of Pickles. CrkL
is sandwiched by YFP and CFP. Phosphorylation on Y207 and its reversal, respectively,
increase and decrease FRET efficiency. Typical spectra of Pickles in the presence (solid)
and absence (gray) of BCR-ABL are also shown (right panel). (C) Time- and IM-dependent
decrease in the FRET efficiency of Pickles. CML cells were treated with vehicle (square) or
IM (rhombus) at time point 0. Emission ratios (FRET/CFP) were obtained using fluores-
cent microscopy, and their ratios are plotted, along with SD. (D) Comparison of the dose
responsiveness of the biosensor and of Western blotting. Emission ratio of Pickles (FRET)
and levels of phosphorylated CrkL (WB) at the indicated concentrations were quanti-
tated, normalized to those observed in the absence of IM, and plotted, along with
SD. (E) Flowchart of FRET-based evaluation of drug efficacy in patient samples. Finally,
the patient is judged as resistant when cells with FRET
2.04 remain after IM treatment
(right), while cells with emission ratios between 1.5 and 2.02 are used to evaluate drug
responsiveness.
>


Search WWH ::

Custom Search