Biology Reference
In-Depth Information
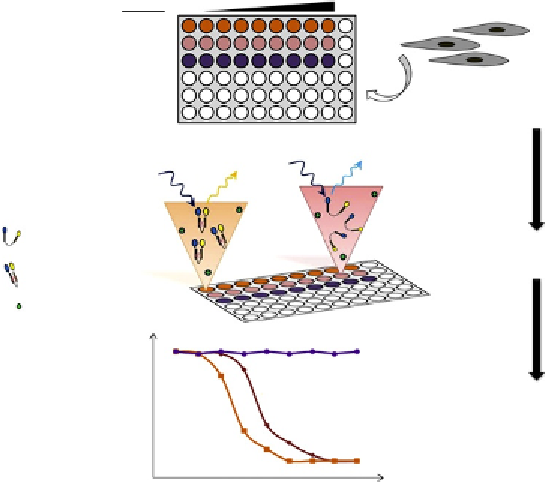
Inhibitor
MEK inhibitor, U0126
Potential ERK inhibitor A
Potential ERK inhibitor B
#1
#2
#3
Cell culture, transfection of EKAR,
and inhibitor treatments
CFP emission
wavelength
CFP excitation
wavelength
YFP emission
wavelength
FRET
FRET CFP/YFP biosensor
in “OFF” state
FRET CFP/YFP biosensor
in “ON” state
Kinase of interest purified (+ATP)
High-throughput screening
of biosensors FRET efficiency
#3
#2
Data analysis reveals that the
“potential ERK inhibitor A”
inhibits ERK!
#1
Inhibitor concentration
Figure 5.23 Schematic representation of the method for the evaluation of kin-
ase inhibitor with the FRET-based biosensor EKAR by high-throughput screening.
apparent easier acquisition procedure makes it available to researchers who
are unaware of the factors that might complicate fluorescence quantification.
We will thus focus here on some key elements responsible for these
misinterpretations.
Fluorescence microscopy is mainly used for qualitative imaging of protein,
lipid, or nuclear acid distribution in cells. Indeed, quantifying the distribution
of these molecules is highly complicated by various optical, physical, and bi-
ological parameters.
140
Many of them can be circumvented by ratiometric im-
aging and are not an issue in the case of KAR imaging. However, several
parameters remain critical. For example, the properties of the illumination
sources, the optics of the microscope, or the sensitivity and signal-to-noise
ratio of the detectors can affect both fluorescence and ratio measurements.
Some of these parameters can be easily optimized by a careful choice of
the elements available on the acquisition systems. For instance, using apochro-
matic objectives with corrected chromatic aberration to avoid focusing the
excitation wavelength at two different positions will prevent strong border
effects. Others are more difficult to avoid (
Fig. 5.24
gives several examples)

Search WWH ::

Custom Search