Biology Reference
In-Depth Information
corresponds to one pixel of the FLIM image and vice versa. Consequently,
one FLIM image is transformed into a scatter diagram whose position gives
an indication on the number of exponentials present in the intensity decay.
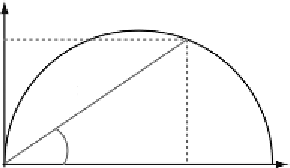
For example, when the fluorescence emitted by the sample decays
monoexponentially, the scatter diagram is localized on the semicircle
centered at [0.5, 0] with a radius of 0.5 (see
Fig. 5.19
). Short fluorescence
lifetimes are close to the coordinates [1, 0], whereas long lifetimes
approach the origin ([0, 0]). If multiple lifetime components are present
in the sample, the scatter histogram is located inside the semicircle, which
can be helpful for identifying a mixture of several molecular species or a
FRET phenomenon.
89,96
This approach can be applied with both FD
96
A
t
2
=2 ns
t
2
=1.5 ns
t
=1.5 ns
B
On the 1/2 circle
t
Monoexponential
decay
=2.5 ns
v
t
=1.0 ns
t
=4.0 ns
t
2
=1 ns
m
t
2
=0.5 ns
Inside the 1/2 circle
multiexponential decay
j
0
u
0
1
C
t
=90 min
t=0
Low FRET
t
j
High FRET
2.0
t
=0
t
=90
1.5
20
m
m
20
m
m
1.0
Figure 5.19 Data analysis of fluorescence lifetime measurements with the polar
approach or phasor. (A) Illustration of the polar representation. Lifetime measurements
of fluorescent sample with single-exponential decay are localized on the semicircle. If
multiple lifetime components are present in the sample, the FLIM acquisitions are lo-
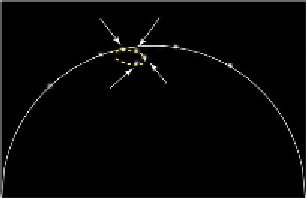
cated inside the semicircle. (B) Example of the polar representation with simulated FLIM
images. As expected, spots corresponding to FLIM images simulated with mono-
exponential decays are positioned on the semicircle whereas spots issues from simu-
lated data with biexponential decays are inside. Also represented with dashed line is
the FRET trajectory for a proportion of interacting donor
a
1
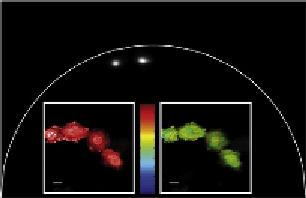
¼0.5. (C) Application of
the polar representation to biosensor experiment realized in living cells transfected with
T
Epac
VV
. We can clearly distinguish two spots corresponding to both conformations of
the biosensor (high FRET and low FRET). We have also displayed resulting phase lifetime
images.

Search WWH ::

Custom Search