Biology Reference
In-Depth Information
C
0.02
t
j
3.4
3.2
3.0
2.8
2.6
2.4
2.2
2.0
1.8
1.6
t
m
t
j
0.015
A
Reference data
Reference fit
Sample data
Sample fit
t
=0
t
= 420
t
= 900
0.01
6
10
4
5
10
4
0.005
t
m
10
4
4
0
t
=0
t
= 420
t
= 900
1
2
3
Lifetime (ns)
4
5
6
3.2
3
10
4
D
2
10
4
B
3.0
1
1
10
4
2.8
0
0
50
100
150
200
250
300
350
Phase shift
D
F
(degree)
t
j
(ns)
t
m
(ns)
2.6
10
m
m
2.4
0
200
400
600
800
Time (s)
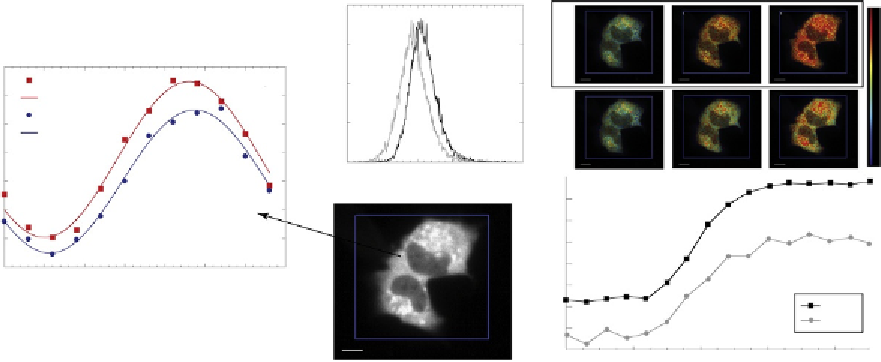
Figure 5.17 Data analysis of fluorescence lifetime measurements acquired with homodyne method. (A) Experimental reference and sample
fluorescence intensities (dots) as a function of the phase shift D
f
between excitation and detection for one pixel; the corresponding fits from
which the phase ' and modulation
m
are deduced are indicated with lines. (B) Fluorescence intensity image of living cells transfected with
T
Epac
VV
. Phase and modulation lifetime (
t
m
and
t
'
) distributions for the selected area are represented in (C). Mean values are deduced from
these distributions and their evolutions in time are shown in (D). Corresponding phase and modulation lifetime images are also displayed for
three distinct times.

Search WWH ::

Custom Search