Biology Reference
In-Depth Information
2.5
t
=0
t
=13
t
=25
C
After induction
2.0
R
1.5
20
m
m
Before induction
0.6
1.1
1.0
Cell2
0
200
Cell1
D
0.5
1
0
R
cell1
R
cell2
0
0.5
1
1.5
2
2.5
0.8
Ratio
B
A
0.6
0.4
Cell1
D
R/R
t
0
cell1
D
R/R
t
0
cell2
Cell2
0.2
20
m
m
20
m
m
0
0
5
10
15
20
t
(min)
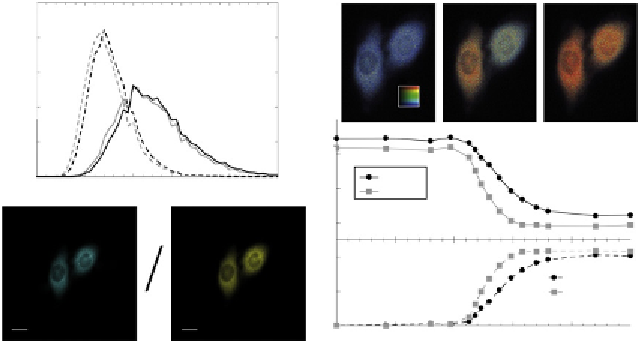
Figure 5.16 Data analysis for FRET imaging with a standard wide-field epi-fluorescence
microscope. The fluorescence intensity images of living cells transfected with
T
Epac
VV
acquired with two distinct filters sets: donor emission and acceptor emission (after do-
nor excitation) are shown, respectively, in (A) and (B). The resulting ratio
can be cal-
culated pixel by pixel (after instrumental correction) and the ratio distributions of both
cells are indicated in (C) before (
R
25 min). The mean ratio is
extracted from these distributions for each cell and plotted as a function of time in (D).
The corresponding ratio images are also represented in the upper part of the panel.
Finally, also indicated in (D) is the normalized ratio D
R
=
R
t
0
which simplifies the compar-
ison between cell responses.
t
¼
0) and after induction (
t
¼
where
R
t
0
is the initial ratio (measured at time
t
0).
The fact that this normalized ratio (and the ratio
R
) gives just an indica-
tion of the relative changes between the biosensor “ON” and “OFF” states
must be emphasized. In other words, determination of individual concen-
trations of both biosensor states with ratiometric imaging is not feasible in
the cellular environment,
75
since all biosensors expressed are not optically
active. In fact, the maturation and the photodegradation (photobleaching)
of the two fluorescent proteins (donor and acceptor) are processed at differ-
ent rates.
70,76
This leads to a population of biosensors whose fluorescence
emission is no more related to the physiological state of the cell
(unresponsive donor-only and acceptor-only single-chain biosensors).
¼
5.2. Fluorescence lifetime imaging
Unlike ratiometric imaging, which is based on fluorescence intensity
being directly related to the fluorophore concentration (of both the donor
and the acceptor), lifetime measurements are generally independent of these


Search WWH ::

Custom Search