Biology Reference
In-Depth Information
acceptor. The fluorescence intensity begins to decrease when molecules are
in their excited states. This decrease depends upon the rate of electron de-
excitation and it can be deduced from Eq.
(5.7)
:
I
0
e
t=
t
I
t
¼
½
5
:
8
1
With t
¼
½
5
:
9
K
g
þ
K
nr
þ
K
T
where K
nr
is the nonradiative rate of the donor only. The fluorescence life-
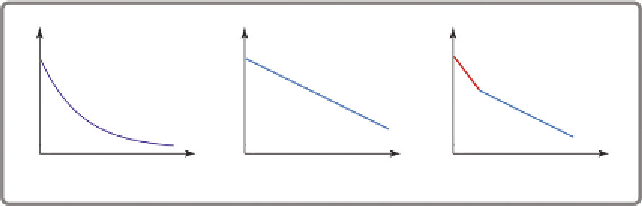
time is in fact the inverse of the slope of the curve measuring the fluorescence
as a function of time in a semilogarithmic representation (
Fig. 5.7
).
The fluorescence impulse response function
I
(
t
) is often represented by a
multiexponential decay model
X
a
i
e
t=
t
i
It
ðÞ¼
½
5
:
10
i
where t
i
are the decay times and a
i
are the amplitudes of the components.
The values of a
i
and t
i
may have a direct or an indirect molecular signifi-
cance. For a mixture of fluorophores, if each component has a single decay
time, t
i
are their decay times
(Fig. 5.7)
. The parameters a
i
and t
i
cannot al-
ways be attributed to molecular features of the sample. Alternatively, the
measured intensity decay can be fitted with Eq.
(5.10)
. The values of a
i
and
t
i
can be used to calculate the
fractional contribution f
i
of each decay time t
i
to
the steady-state intensity:
a
i
t
i
X
i
a
i
t
i
f
i
¼
½
5
:
11
a
1
e
(-
t
/
t
1)
a
1
e
(-
t
/
t
1)
a
1
e
(-
t
/
t
1)
(-
t
/
t
2)
+
a
2
e
Time
Time
Time
Figure 5.7 Fluorescence lifetime decay profiles:
t
2
<
t
1
(adapted from the Nikon
website).


Search WWH ::

Custom Search