Geoscience Reference
In-Depth Information
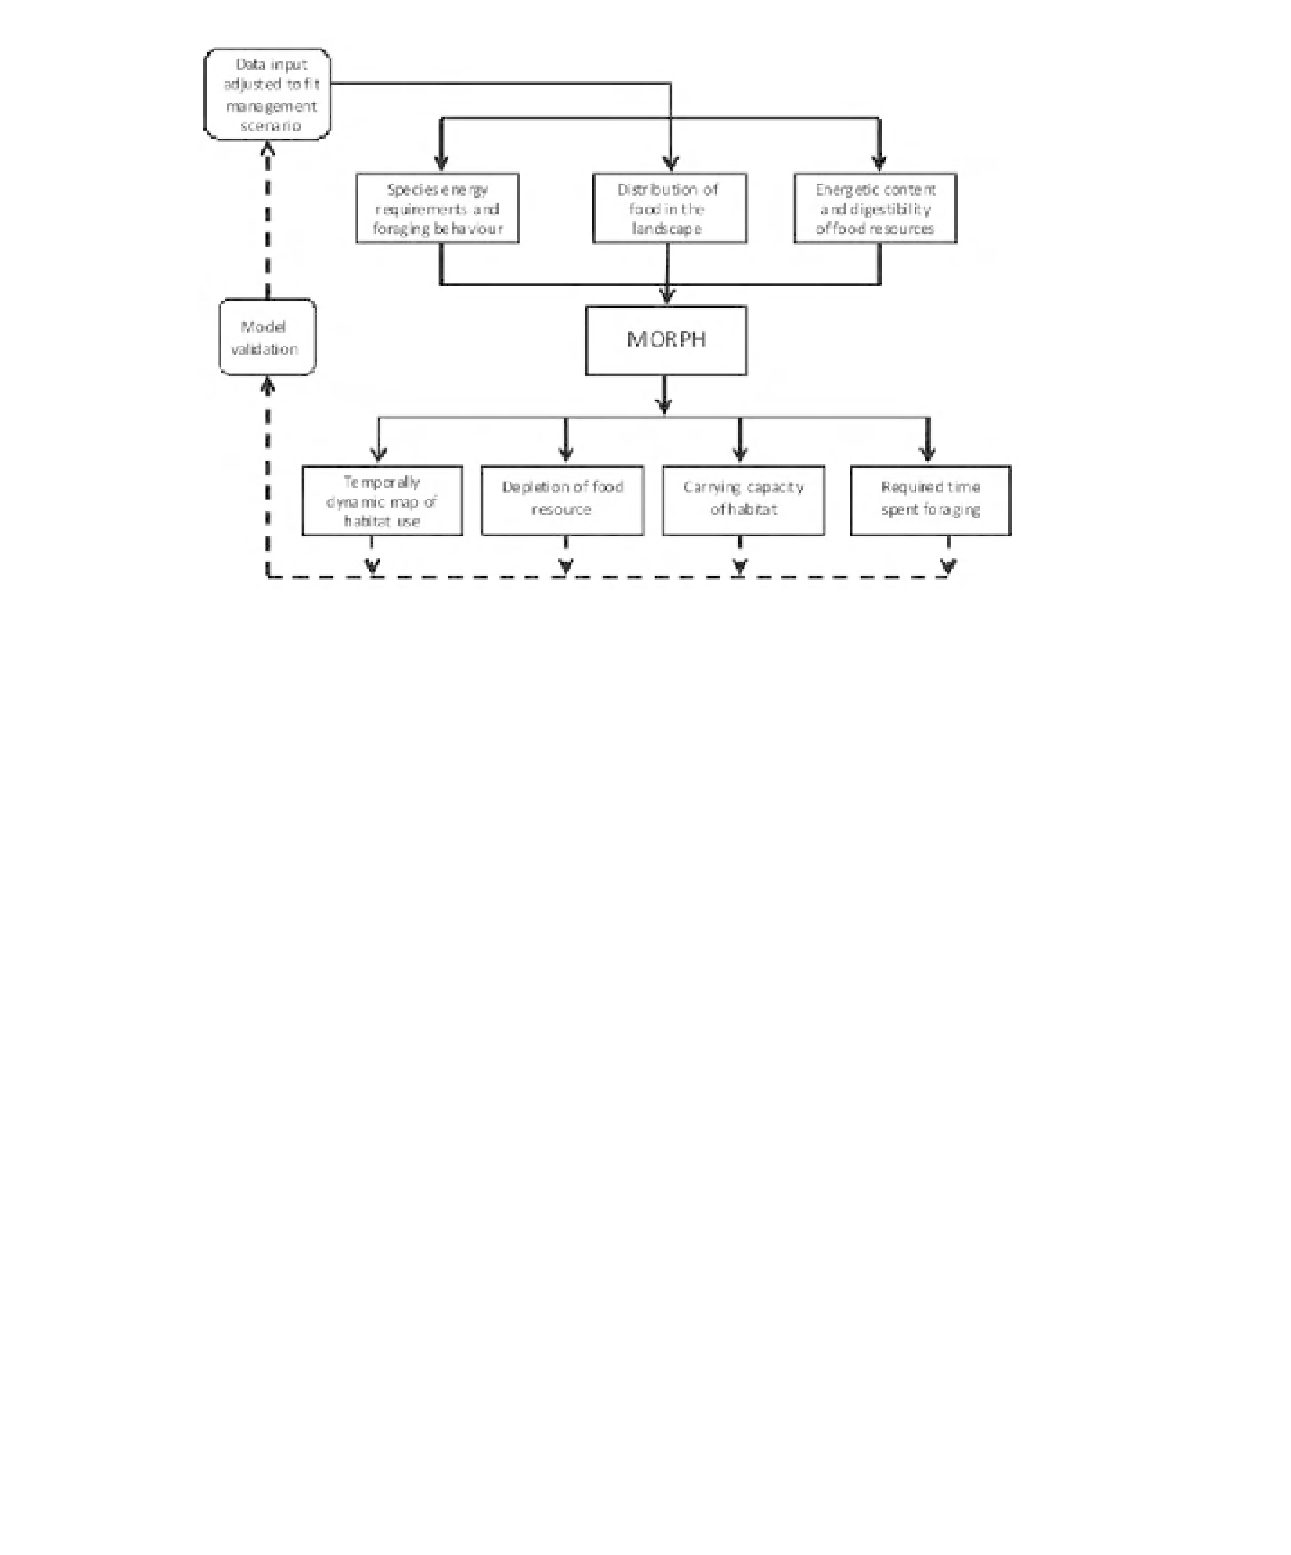
Figure 27.1
A concept diagram of the individual-based model 'MORPH', illustrating the key parameters required
(inputs) and the predictions generated (outputs).
movements of animals on the basis that foragers
attempt to maximize their perceived fitness.
This approach has been used successfully to test
management scenarios for the conservation of
coastal wading bird populations (Stillman and
Goss-Custard, 2010; Figure 27.1). This chapter
briefly describes how an IBM for a population
of swans in a chalk river was developed and
tested, and suggests how this approach could
be used as a decision support
based on shared environmental characteristics and
hereafter referred to as 'river patches'. The nine
river patches ranged from 93.0 to 1193 m
2
in area, while the adjacent field patch area was
50 000 m
2
. For each patch a value was assigned
to each parameter required by the MORPH model
(Stillman, 2008) using a combination of field data
and available literature sources (Table 27.1). The
MORPH model was then tested against field data
reported by O'Hare
et al.
(2007).
Grass biomass in the pasture field was sampled in
May and June 2010 using a 0.00785 m
2
hand corer
(
n
=
5 for each month); all above-ground biomass
was removed, dried to constant weight at 60
◦
C
using a Heraeus Kelvitron T oven and then weighed
to
±
0.1 g on a Pesola PTS3000 balance. Change in
grass biomass over time (in the absence of swan
grazing) was calibrated to zero (0.0 g m
−
2
d
−
1
)
because a t-test indicated that statistically there was
no significant difference between values in May
(mean 203.8 g m
−
2
tool
for
river
management.
Methods
Parameters for the IBM known as MORPH
(Stillman, 2008) were derived and tested for a 1.1
km length of the River Frome and an adjacent
pasture field in Dorset, in southern England,
(50
◦
41'N, 02
◦
11'W) for 22 days during May-June
2010. Detailed information for the study site
is described in O'Hare
et al.
(2007). For the
model, the river was divided into nine sections,
±
26.0 SD) and June (mean
196.2 g m
−
2
±
107.6 SD) (
t
=
0.15, d.f.
=
8,
=
p
0.88), probably due to cattle grazing.

