Geoscience Reference
In-Depth Information
Distance from source (km)
0
25
50
75
100
125
150
175
200
225
250
275
14
A
1923
12
10
8
6
4
2
0
B
1937
12
10
8
6
4
2
0
C
1953
12
10
8
6
4
2
0
D
1972
12
10
8
6
4
2
0
E
2008
East Midlands
Nottingham
12
The
Potteries
West Midlands
Burton
10
8
6
4
2
0
0
25
50
75
100
125
150
175
200
225
250
275
Distance from source (km)
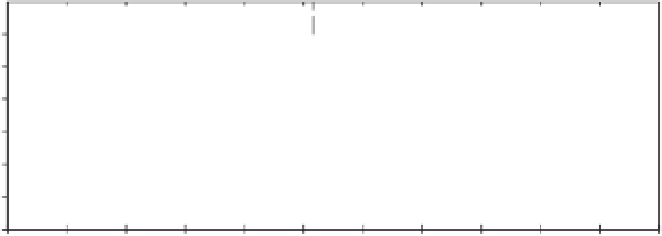
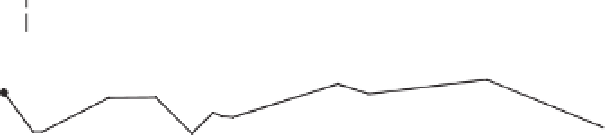
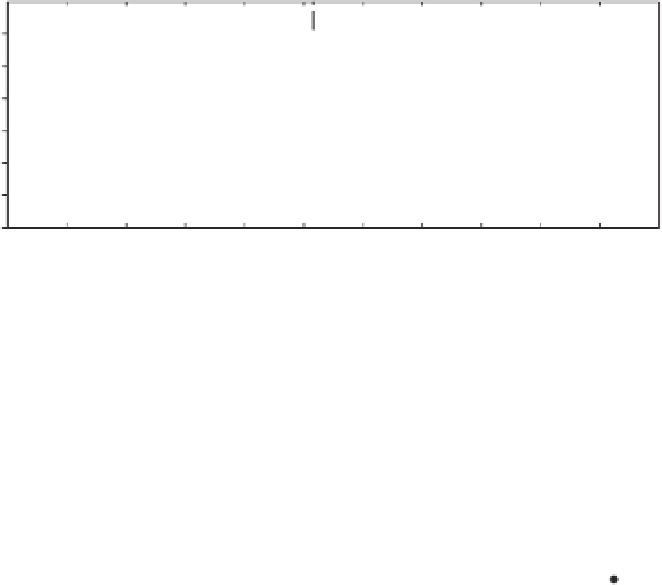
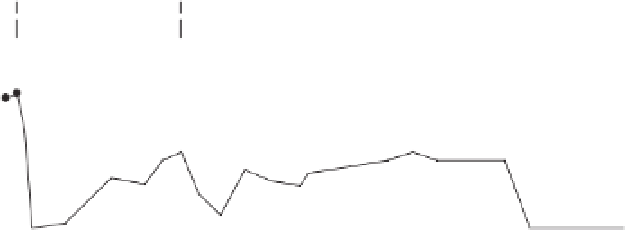
Figure 21.2
Minimum dissolved oxygen concentrations along the main River Trent,1923 to 2008. Dotted horizontal
lines show 5 mg L
−
1
dissolved oxygen. Solid horizontal bars show locations of urbanized and industrialized sections
along the river.