Geoscience Reference
In-Depth Information
Specific Indicators
Area/Distribution
range
Structure &
composition
Vulnerability
Favourable
Favourable
Not vulnerable
Favourable conservation status (safe)
Vulnerable
Favourable conservation status (at risk)
Inadequate
Inadequate conservation status
Inadequate
Inadequate conservation status
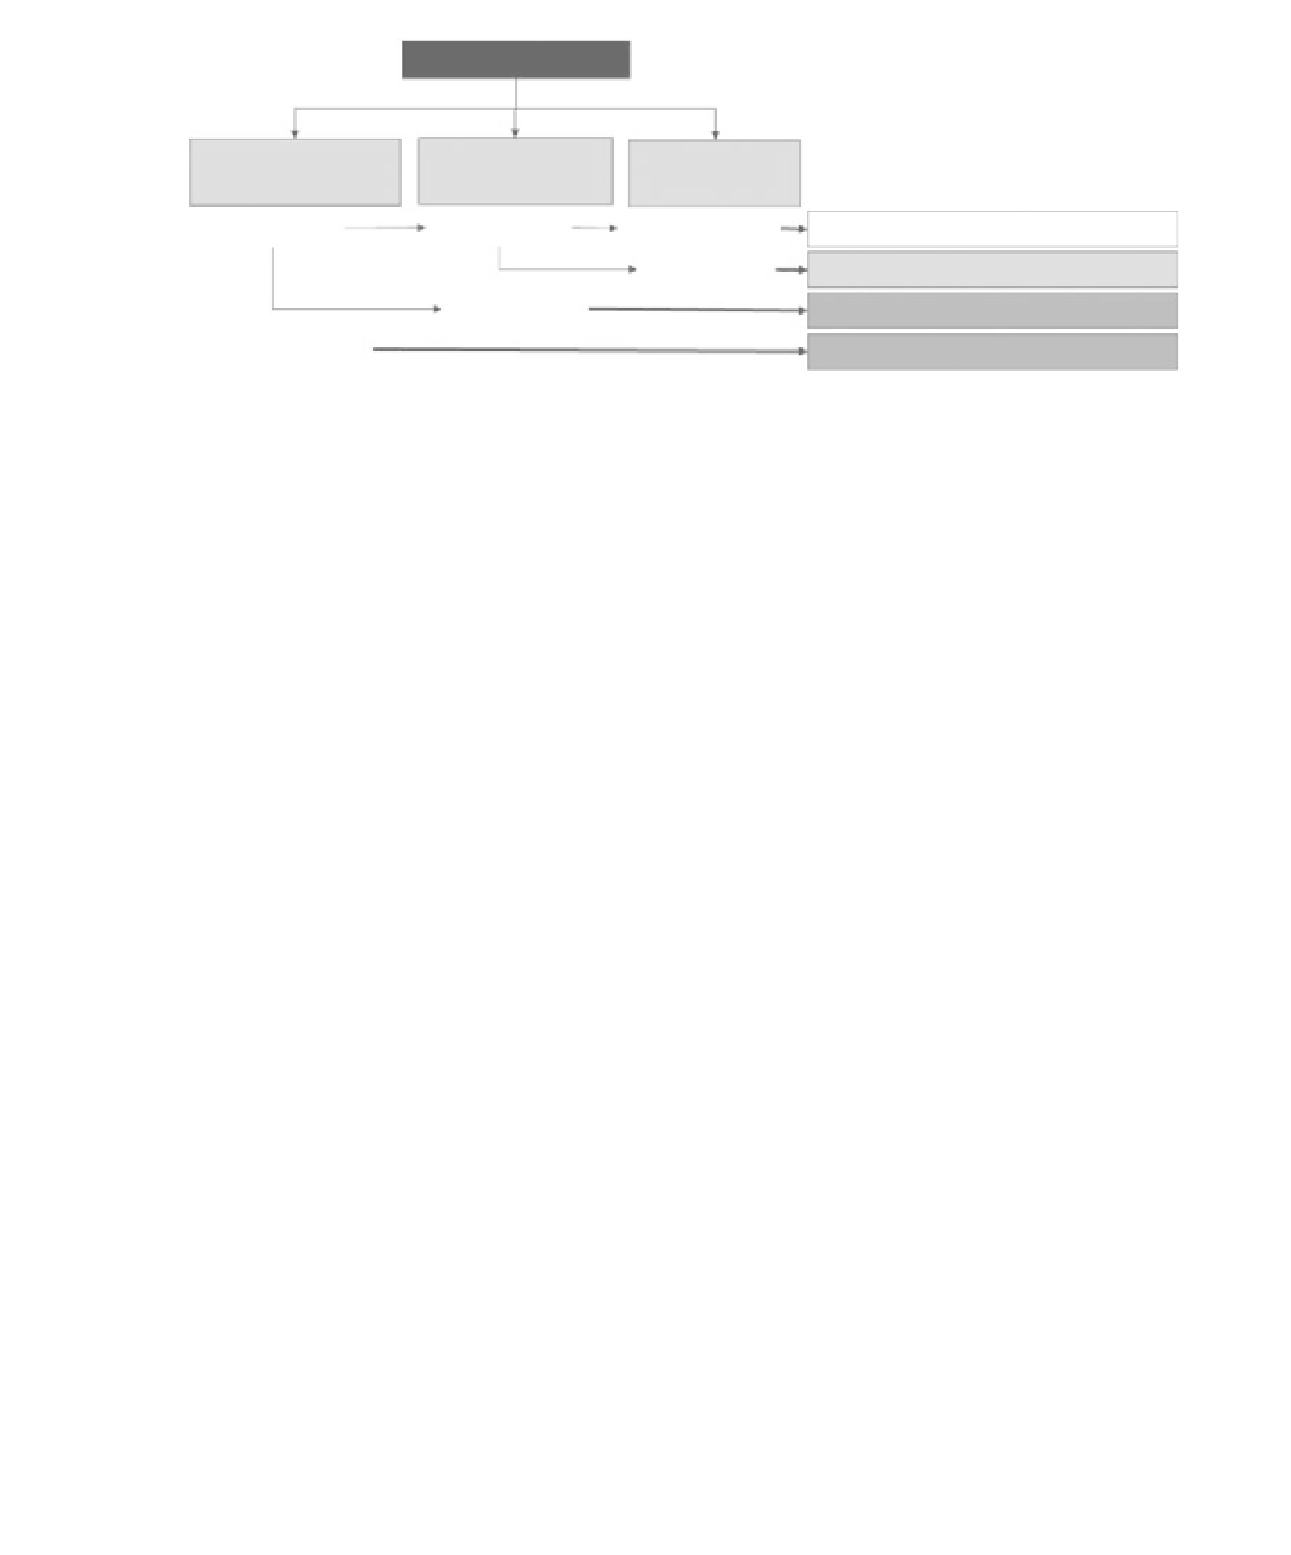
Figure 16.5
The different variables used for specific indicators to assess conservation of species and habitats in the
Natura 2000
river network of Cantabria.
generations represent 15-18 years for Atlantic
salmon in Cantabria. The current distribution
of salmon was determined by recent catch
records and electro-fishing surveys (Figure 16.1).
Reference distribution range was determined using
a combination of known historical distribution
range and habitat suitability models (Garcıa de
Le aniz
et al.
, 1992). These models predicted the
presence/absence of salmon using catchment
variables such as channel slope, altitude, average
annual precipitation and geology and the 2010
electro-fishing survey results as response variables
using classification and regression trees (De'ath
and Fabricius, 2000; IH Cantabria, 2010).
Population structure and composition were
determined using four measures: (i) the number
of adult fish; (ii) the proportion of grilse (first sea-
winter fish); (iii) the proportion of adult females;
and (iv) average fry density per spawning gravel
area. These variables are important in establishing
the risk of extinction (Meffe and Carroll, 1997;
Primack, 2008), the effects of fishing pressures
(Garcıa de Le aniz
et al.
, 1992; Garant
et al.
, 2003),
population dynamics (Consuegra and Garcıa de
Leaniz, 2007) and reproductive success (Elliot,
1996). The information was relatively easy to
calculate from Regional Government records and
similar data are likely to be collected in the
future. Specific indicators were calculated for each
river population, although genetic flow among
these salmon populations is known to be frequent
(Consuegra
et al.
, 2005).
Trends in the number of salmon caught can
indicate whether the population is sustainable.
Catch records for Atlantic salmon are highly
variable (cf. Klyashtorin and Rukhlov, 1996),
so using a 5-year running average which is
equivalent to the average generation time-span
(Garcıa de Le aniz
et al.
, 1992) provides a smoothed
trend (Figure 16.6b). Our assertion was that
a salmon population achieves favourable status
when the 5-year average capture was equal to
or larger than the one calculated 15 years (i.e.
three generations) before the date of evaluation,
provided that at least 100 adults were caught
(Consuegra and Garcıa de Leaniz, 2007; Kuparinen
et al.
, 2010). The numbers for 2004-2008 were
therefore
compared
with
those
caught
during
1990-1994.
The proportion of grilse and female adults was
calculated for 1990-2008 and benchmark values
derived from previous studies (Garcıa de Le aniz
et al.
, 1992; Consuegra and Garcıa de Leaniz,
2007). On this basis, the population structure and
composition was determined as favourable when
the proportion of grilse in the catch was
10%
and the proportion of female adults exceeded
30%. Average fry density per spawning gravel area
was calculated using electro-fishing surveys and
estimating total gravel area within each 500 m
length of river sampled.
Vulnerability was calculated on the basis of
sensitivity and degree of exposure to pressures; this
was determined by the overlap between current