Geoscience Reference
In-Depth Information
aquatic insects is somewhat more complex in the
face of increasing salinity than that suggested by
Hart
et al
. (1991).
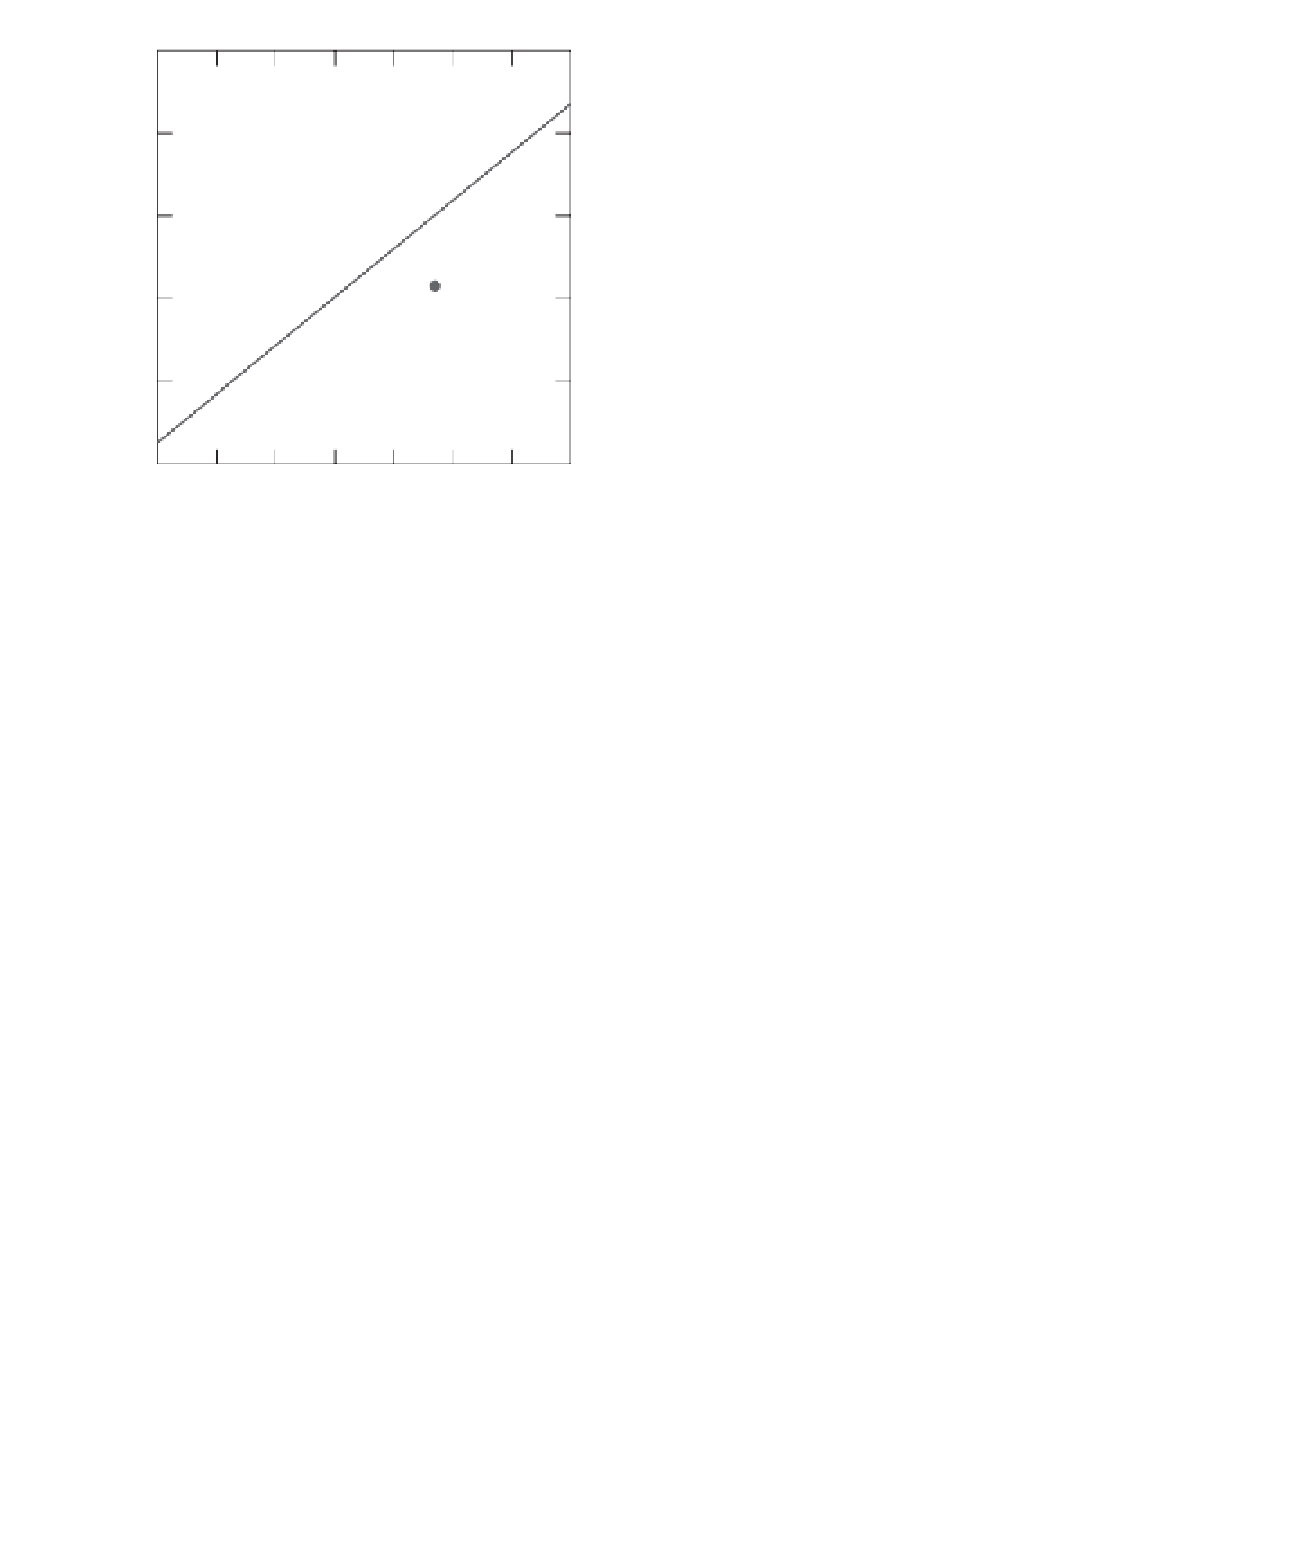
0.8
0.7
Delta
as a diversity index
Many of the disturbances to catchments and
rivers, such as increasing salinity levels, occur over
broad geographic scales and it is only logical that
biological monitoring should occur on a similar
spatial scale (Johnson and Gage, 1997; Marchant
et al
., 1999). If a gradient of disturbance is present
or suspected in data collected over a large scale,
then it should be possible to assign sites to different
categories of disturbance, as done here with salinity
levels. Delta
+
0.6
0.5
0.4
can then be calculated as an index of
diversity without concern for the inevitably uneven
sampling effort associated with each category. In
this manner it may be possible to gain at least
a preliminary view of the effects of a specific
disturbance over a large region.
With a large dataset it should also be possible to
regress delta
+
against a variety of environmental
variables in an effort to determine whether
predictor variables exist. Marchant (2007) tried
this for data from the Australian state of Victoria,
using seven uncorrelated variables relating largely
to longitudinal changes along river channels and
delta
+
values from essentially undisturbed sites
in 27 river basins. These regressions explained
little of the variance in delta
+
(8-12% depending
on whether data came from the bank or
channel habitat) and this seemed due to the
mostly undisturbed nature of the sites. With sites
spanning a wider range of quality a number
of predictor variables might be identified. Heino
et al
. (2005) showed that taxonomic distinctness
varied strongly along environmental gradients for
stream invertebrates in Finland. As a consequence,
they doubted whether delta
+
0.3
87
88
89
90
91
92
93
94
DELTA
Figure 14.3
The relationship between feeding diversity
and delta
+
for insect species from the bank habitat. Each
point represents the feeding diversity for an individual
salinity category.
(and all macroinvertebrates) actually rose slightly
between categories 1 and 5 (they used the same
salinity categories as shown in Table 14.1 and data
for bank habitats only). Beyond category 5 species
richness declined slowly to category 13 and then
more rapidly for categories 14 to 16. There was
again no indication of a threshold at category 8.
For EPT species Kefford
et al
. (2011) recorded a
continual, more or less even, decline over the
whole salinity gradient, with approximately 50%
of EPT species (in 21 samples) being lost at around
category 5 or 6.
The contrast between the patterns revealed
by species richness and taxonomic distinctness
perhaps reflects the dissimilar ways these indices
respond to disturbance. For example, as salinity
increases, the loss of species, but not higher taxa
such as genera or families, will result in small
declines in delta
+
, but larger declines in species
richness. There is some evidence that this is
occurring as Kefford
et al
. (2011) found that family
richness varied less with increasing salinity than
species richness. Despite these different responses,
both indices suggest that the decline in diversity of
alone could be
used to distinguish degraded sites, but they did
not
+
test
this by constructing funnel plots for
their data.
Experience suggests that delta
+
is unlikely to
be sensitive to disturbances unless species data
are used in the calculations (Marchant, 2007):
delta
+
calculated using the genus or family levels
from the current dataset varied very little (results