Geoscience Reference
In-Depth Information
levels; no weighting of taxonomic categories was
used. Two reduced datasets consisting only of
Ephemeropteran, Plecopteran and Trichopteran
(EPT) species (for bank and channel habitats) were
also compiled and delta
+
recalculated. In all cases
average delta
species lists and were superimposed on the plots
of delta
+
versus species number, also using the
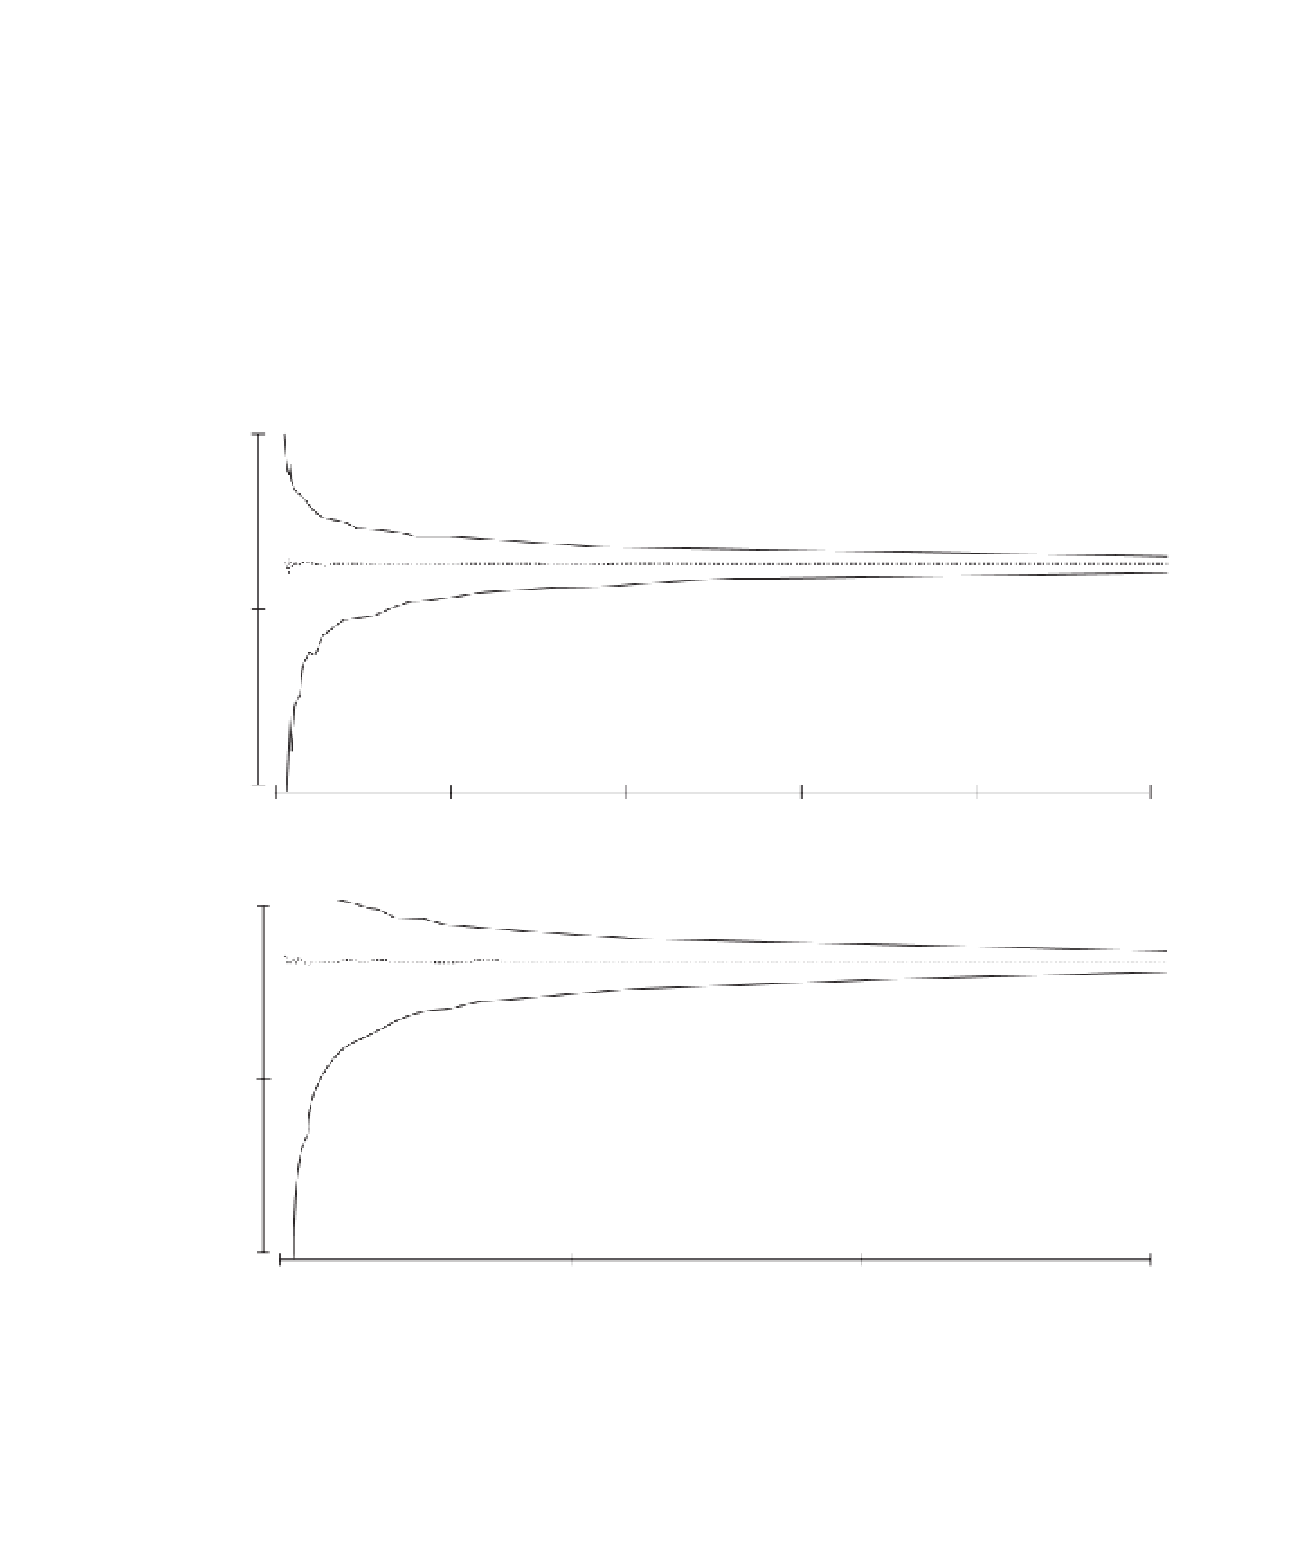
TAXDTEST routine. The funnel shaped confidence
limits (hence the name funnel plots) are drawn as
continuous lines above and below an essentially
horizontal line representing the expected value of
delta
for a given EC category was plotted
against the number of species recorded in that
category.
The expected values for delta
+
(Figure 14.1). The fact that the expected
value is horizontal or constant demonstrates its lack
of sensitivity to sample size (as measured by the
number of species recorded). It is clear, however,
that the confidence limits widen rapidly when
+
+
and its 95%
confidence limits (for variously sized subsets) were
determined by random sampling from the master
(a)
100
4
6
2
8
7
3
1
11
1
12
5
9
14
13
90
15
16
80
0
100
200
300
400
500
Number of species
(b)
95
10
9
5
7
6
8
11
12
4
3
13
1
2
14
15
90
16
85
0
200
400
600
Number of species
Figure 14.1
Funnel plots of delta
+
for all insect species from (a) bank habitats and (b) channel habitats. The numbers
indicate the salinity categories (Table 14.1).