Geoscience Reference
In-Depth Information
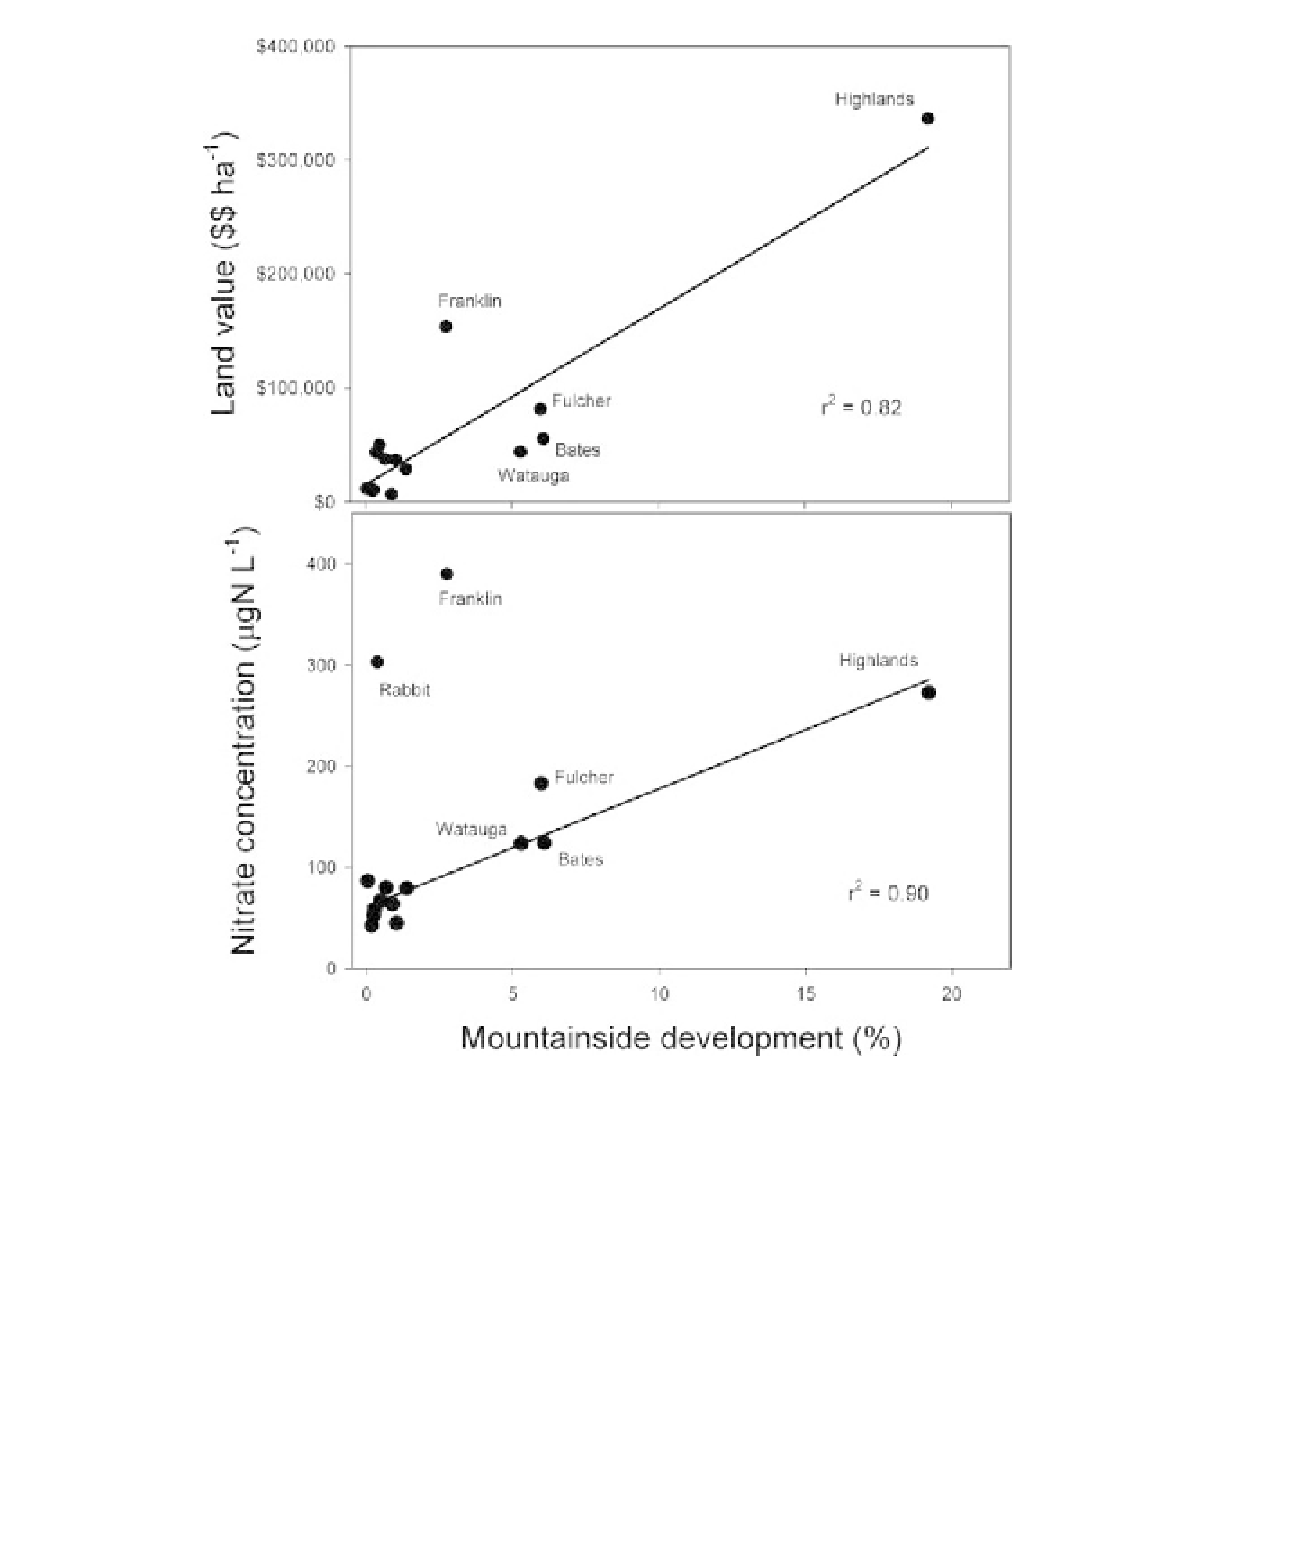
Figure 8.9
Nitrate concentration and land value (US dollars) relationships to mountainside development.
Mountainside development was quantified as the percentage of developed land-cover area that was also in the upper
60% of the catchment altitude. Linear regression lines and coefficient of determination are shown in the figures. Data
for Franklin and Rabbit Creek were not used in the regression shown in the lower panel.
and Wiley, 1988; Johnson
et al
., 1997; Jones
et al
., 2001). Other studies have shown little
difference between using catchment and riparian
land-cover (Johnson
et al
., 1997; Dodds and Oakes,
2008) for predicting stream responses. Most studies
comparing land cover and stream chemistry have
been conducted in areas of little topographic relief
that are dominated by agriculture (Osborne and
Wiley, 1988; Hunsaker and Levine, 1995; Johnson
et al
., 1997; Jordon
et al
., 1997; Dodds and Oakes,