Graphics Programs Reference
In-Depth Information
If you haven't already done so, go to the topic's web page at
www.sybex.com/
go/civil3d2015essentials
and download the files for Chapter 4. Unzip the files
to the correct location on your hard drive according to the instructions in the
introduction. Then, follow these steps:
1.
Open the drawing named
Elevation Analysis.dwg
located in the
Chapter 04
class data folder.
2.
Click one of the contours to select the surface, and then click Surface
Properties on the ribbon.
3.
Change Surface Style to Elevation Banding (2D).
4.
Click the Analysis tab. Verify that the analysis type is Elevations and
the number of ranges is
8
.
5.
Click the downward-pointing arrow to populate the Range Details
section of the dialog box with new data.
6.
Click OK to return to the drawing. Press Esc to clear the selection of
the surface.
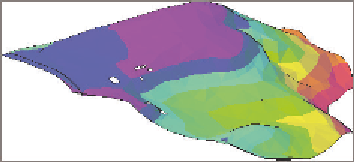
The surface undergoes an obvious change, and it's now displayed
as a series of colored bands with red signifying the lowest elevations
and purple signifying the highest.
◀
7.
Change the style of the surface to Elevation Banding (3D).
Now the 3D view displays the colored bands as a 3D representation
with exaggerated elevations. This tells a clear story about the existing
shape of the land for this site (see Figure 4.15).
You may need to zoom
out a bit in the lower-
right viewport to see
the 3D color represen-
tation of the surface.
FiGuRE 4.15
A 3D view of a surface using
the Elevation Banding (3D) style
8.
Save and close the drawing.
You can view the results of successfully completing this exercise by opening
Elevation Analysis - Complete.dwg
.