Graphics Programs Reference
In-Depth Information
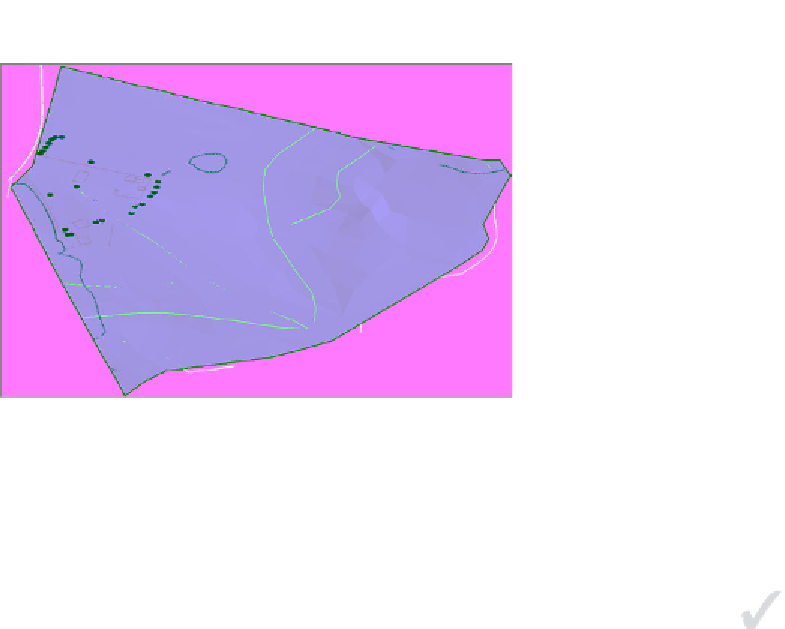
FiGuRE 4.5
A surface shown using the Conceptual visual style
using Breaklines to improve
Surface Accuracy
The TIN algorithm creates surfaces by drawing 3D lines between points that
are closest to each other. In certain instances, this is not the most accurate
way to model the surface, and the TIN lines must be forced into a specific
arrangement. This arrangement typically coincides with a linear feature such
as a curb, the top of an embankment, or a wall. This forced alignment of TIN
lines along a linear feature is best handled with a breakline. In Figure 4.6,
the blue lines represent the edges of a channel and the TIN lines are shown in
red. In the image on the top, the blue lines have not been added to the chan-
nel surface as breaklines, resulting in a rough and inaccurate representation
of the channel. In the image on the bottom, the breaklines have been applied
and force the TIN lines to align with the edges of the channel, producing a
much smoother and more accurate model.
From Prospector, you can add breaklines by right-clicking the Breaklines
node for a given surface and selecting Add (see Figure 4.7). When it comes to
survey data, there is an even easier way. From the Survey Toolspace, you can
right-click Figures and select Create Breaklines. This opens a list of all your
survey figures with some checked as breaklines and some not (see Figure 4.8).
How does the command know which is which? This was specified in the figure
prefix database you learned about in Chapter 3. As the figures were created, they
were automatically tagged as breaklines or non-breaklines according to the code
assigned to the points that define them.
Certification
Objective