Agriculture Reference
In-Depth Information
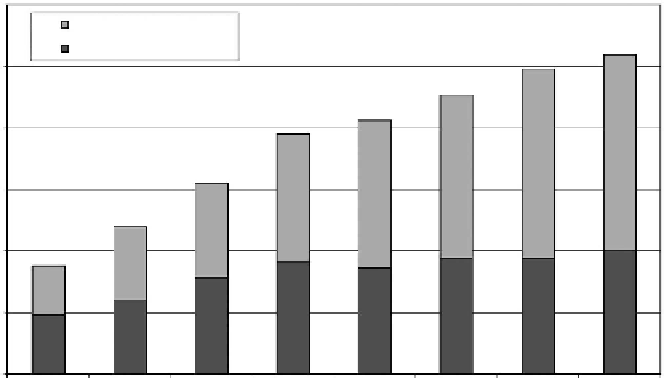
Subsequently, scientific advancements and improved management practices have
continued to increase staple cereal yields. Global cereal production increased from
around 1400 million metric tons (Mt) at the start of the 1970s to >2500 Mt in 2011
(Figure 3.1). While recognizing the importance of advances in breeding and crop
protection products and the expansion of irrigation, there is widespread acknowl-
edgement that much of the production gains are directly attributable to fertilizer
use, which increased from <75 Mt to >150 Mt within the same period. Fertilizers,
primarily nitrogen (N), phosphorus (P), and potassium (K), are estimated to have
contributed 40%-60% (Figure 3.2). Without fertilizers, Erisman et al. (2008) calcu-
lated that global cereal production would have been halved.
Despite widespread adoption, fertilizer consumption by smallholder farmers
(the focus of this chapter) varies greatly by region; however, in every case, there is
a direct correlation between fertilizer consumption and cereal production (Figure
3.3). In some regions, unbalanced use of mineral fertilizers, typically involving high
application rates of N (often influenced by subsidies favoring N fertilizers), exact
considerable and increasing environmental costs (Smil 2011). For example, in some
areas of high fertilizer consumption in South and East Asia (i.e., China, where the
average use rate of NPK fertilizers is 344 kilograms per hectare [kg ha
−1
]), losses of
nutrients through volatilization, leaching, nitrification/denitrification, soil erosion,
and surface water runoff are contaminating land, water, and air. Alternately, in much
of Sub-Saharan Africa (SSA) (i.e., Ghana, where the average use rate of NPK fertil-
izers is 7.5 kg ha
−1
), the underuse of fertilizers, combined with a lack of access to
other nutrient inputs (including organic amendments), is degrading soil fertility at
the expense of future agricultural productivity.
3000
Developing countries
Developed countries
2500
2000
1581
1535
1327
1500
1198
1039
766
1000
587
396
1006
500
942
941
913
863
784
606
481
0
1961
1970
1980
1990
2000
2005
2010
2011
FIGURE 3.1
Global cereal production (Mt). (Adapted from Food and Agriculture Organi-
zation of the United Nations. 2012.
FAOSTAT.
Rome, It a ly.)