Database Reference
In-Depth Information
Understanding Memory Use
As well as maintaining the stability of your database, ensuring you have enough
memory available also has an impact on the performance of your queries. If there is
not enough memory available, then queries may run slowly as old objects are
garbage-collected by the JVM. Because your database size and query profiles may
change over time, it is important to monitor eXist's memory use. Unfortunately,
monitoring a JVM process with tools provided by your operating system (such as
taskmgr.exe
on Windows or
top
on Unix/Linux) rarely gives you a detailed under‐
standing of Java memory usage. However, there are several tools available for moni‐
toring memory use of a JVM and eXist.
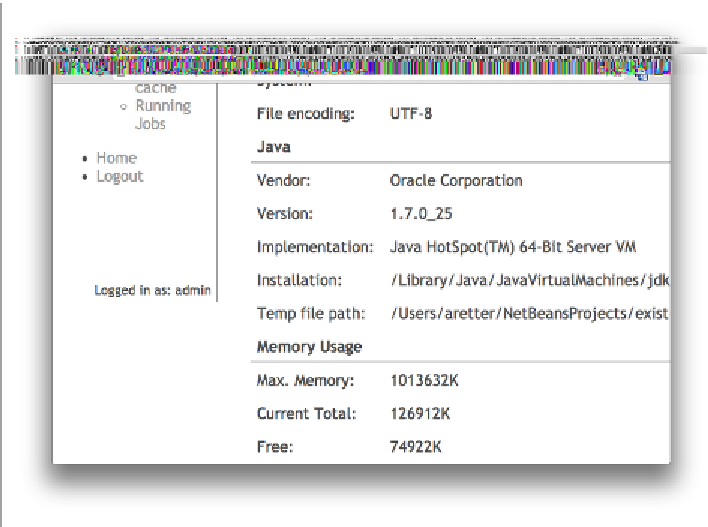
Web Admin Status
The somewhat antiquated Web Admin Application shipped with eXist provides a
quick overview at the bottom of its status page, which you can access from
http://local
host:8080/exist/admin/admin.xql?panel=status
(see
Figure 15-3
).
Figure 15-3. eXist Web Admin Status page
At first glance, the memory status reported by the Web Admin Status page may look
confusing. This is in part because it is a direct reflection of how Java reports and allo‐
cates its memory; however, once you understand how to interpret it, it is relatively


Search WWH ::

Custom Search