Graphics Reference
In-Depth Information
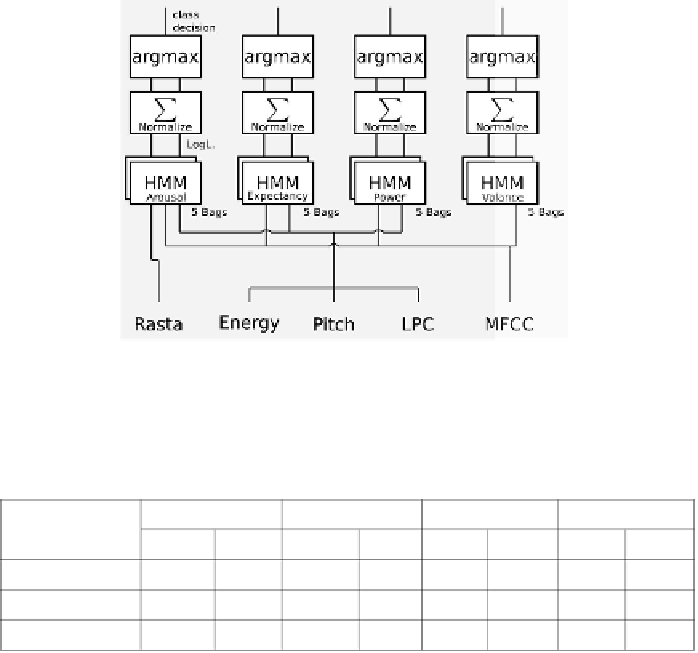
Figure 9.
Architecture of the audio classifi er. For each label, a bag of HMMs have been
trained on selected feature sets.
Table 3. Classifi cation results of the AVEC 2011 development data set. The weighted
accuracy (WA) corresponds to the correctly detected samples divided by the total
number of samples. The unweighted accuracy (UA) is given by the averaged recall
of the two classes.
Arousal
Expectancy
Power
Valence
WA
U A
WA
U A
WA
U A
WA
U A
Audio
66.9
67.5
62.9
58.5
63.2
58.4
65.7
63.3
Visual
58.2
53.5
53.5
53.2
53.7
53.8
53.2
49.8
Audio/Visual
69.3
70.6
61.7
60.1
61.3
59.1
68.8
66.4
an intermediate fusion was conducted using an MLP to obtain the
final prediction. A schema illustrating the architecture used is shown
in Figure 10. The results are reported in Table 3.
Considering the audiovisual challenge, we used the same approach
for each modality as described in the earlier sections but omitted the
last layer in which the class decision was performed. The probabilistic
outputs of the video stream are collected using averaging and
multiplication with a subsequent normalization such that the decisions
are on word level. The HMM log-likelihoods of the label dimensions
are transformed and normalized such that they are ranging between
zero and one.
By concatenating the results of all label dimensions, a new
12-dimensional feature vector is obtained. The new features are then
used to train an intermediate fusion layer based on an MLP.
Like in the audio challenge, the final decision is done on a turn
basis by collecting the outputs within one turn and fusing them using
Search WWH ::

Custom Search